Friday, January 30, 2009

First all-sky map of the edge of the solar system


This IBEX data image shows a dark sky map with the first orbit’s coincidence counts from hydrogen atoms at speeds from about 100,000 (161,000 km) to 36 million miles (58 million km) per hour. The IBEX team is collecting additional orbit data to expose adjacent swaths of the sky to reveal the edge of our solar system. SWRI, San Antonio, Texas

January 13, 2009
Provided by SWRI, San Antonio, Texas


Following two months of commissioning, during which the spacecraft and sensors were tuned for optimum mission performance, the Interstellar Boundary Explorer (IBEX) spacecraft began gathering data to build the first maps of the edge of the heliosphere, the region of space influenced by the Sun.

IBEX is using energetic neutral atom (ENA) imaging to create the first global maps of interactions between the million miles per hour (1,609,000 km/h) solar wind blown out in all directions by the Sun and the low-density material between the stars, known as the interstellar medium.

The maps are built by two ENA cameras, which collectively measure energetic neutral atoms coming in from the edge of the solar system with speeds from about 100,000 miles per hour (161,000 km/h) to some 36 million miles per hour (58 million km/h). Each sensor uses a charge-exchange process that converts incoming neutral atoms into charged ions so they can be analyzed and detected.

The sensors look out from opposite sides of the spacecraft in directions perpendicular to the Sun-pointed spin axis. As the spacecraft spins at four revolutions per minute, the measured ENAs fill in the pixels to build a circular swath that appears as a crescent on the map. As the spacecraft's spin axis tracks the Sun, the swaths move across the sky to complete the image.

"We are seeing fabulous initial results from IBEX, but, just as artisans use looms to build up colorful textiles by weaving one thread at a time, the IBEX sensors also need time - six months - to build up a complete map of the sky," said Dr. David McComas, IBEX principal investigator and senior executive director of the Space Science and Engineering Division at Southwest Research Institute in San Antonio, Texas. "So far, the intricate pattern of this fascinating interaction is only just beginning to disclose itself to us."

IBEX will enable researchers to examine the structures and dynamics of the outer heliosphere and to investigate the acceleration and propagation of charged particles in this complex and important region. IBEX also will address a serious challenge facing manned exploration by studying the region that shields Earth from the majority of galactic cosmic ray radiation.

"The space physics community is holding its collective breath waiting for these maps, which will provide a much deeper understanding of the Sun's interaction with the galaxy," said McComas. "We expect the first complete image, due this summer, to tell us a great deal about the heliosphere's fundamental nature."

NASA balloon mission tunes in to a cosmic radio mystery


A mysterious screen of extra-loud radio noise permeates the cosmos, preventing astronomers from observing heat from the first stars. The balloon-borne ARCADE instrument discovered this cosmic static (white band, top) on its July 2006 flight. The noise is six times louder than expected. Astronomers have no idea why. NASA/ARCADE/Roen Kelly

January 7, 2009

Listening to the early universe just got harder. A team led by Alan Kogut of NASA's Goddard Space Flight Center in Greenbelt, Maryland, announced January 7, 2009, the discovery of cosmic radio noise that booms six times louder than expected.

The finding comes from a balloon-borne instrument named Absolute Radiometer for Cosmology, Astrophysics, and Diffuse Emission (ARCADE). In July 2006, the instrument launched from NASA's Columbia Scientific Balloon Facility in Palestine, Texas, and flew to an altitude of 22 miles (35 km), where the atmosphere thins into the vacuum of space.

ARCADE's mission was to search the sky for heat from the first generation of stars. Instead, it found a cosmic puzzle.

"The universe really threw us a curve," Kogut said. "Instead of the faint signal we hoped to find, here was this booming noise six times louder than anyone had predicted." Detailed analysis ruled out an origin from primordial stars or from known radio sources, including gas in the outermost halo of our own galaxy. The source of this cosmic radio background remains a mystery.

Many objects in the universe emit radio waves. In 1931, American physicist Karl Jansky first detected radio static from our own Milky Way galaxy. Similar emission from other galaxies creates a background hiss of radio noise.

The problem, said team member Dale Fixsen of the University of Maryland at College Park, is that there doesn't appear to be enough radio galaxies to account for the signal ARCADE detected. "You'd have to pack them into the universe like sardines," he said. "There wouldn't be any space left between one galaxy and the next."

The sought-for signal from the earliest stars remains hidden behind the newly detected cosmic radio background. This noise complicates efforts to detect the very first stars, which are thought to have formed about 13 billion years ago - not long, in cosmic terms, after the Big Bang. Nevertheless, this cosmic static may provide important clues to the development of galaxies when the universe was less than half its present age. Unlocking its origins should provide new insight into the development of radio sources in the early universe.

"This is what makes science so exciting," said Michael Seiffert, a team member at NASA's Jet Propulsion Laboratory in Pasadena, California. "You start out on a path to measure something - in this case, the heat from the very first stars - but run into something else entirely, something unexplained."

ARCADE is the first instrument to measure the radio sky with enough precision to detect this mysterious signal. To enhance the sensitivity of ARCADE's radio receivers, they were immersed in more than 500 gallons of ultra-cold liquid helium. The instrument's operating temperature was just 2.7° Celsius above absolute zero.

This is the same temperature as the cosmic microwave background (CMB) radiation, the remnant heat of the Big Bang that was discovered as cosmic radio noise in 1965. "If ARCADE is the same temperature as the microwave background, then the instrument's heat cannot contaminate the cosmic signal," Kogut said.

Astronomers crack lunar mystery


Scientist-astronaut Harrison H. Schmitt is photographed standing next to a huge, split boulder during the third Apollo 17 extravehicular activity (EVA-3) at the Taurus-Littrow landing site on the Moon. NASA

January 14, 2009

Provided by MIT, Cambridge, Maryland


The collection of rocks that the Apollo astronauts brought back from the Moon carried with it a riddle that has puzzled scientists since the early 1970s: What produced the magnetization found in many of those rocks?

Researchers at Massachusetts Institute of Technology (MIT) carried out the most detailed analysis of the oldest pristine rock from the Apollo collection and have solved the longstanding puzzle. Magnetic traces recorded in the rock provide strong evidence that 4.2 billion years ago the Moon had a liquid core with a dynamo, like Earth's core today, that produced a strong magnetic field.

The Moon rock that produced the new evidence was long known to be a very special one. It is the oldest of all the Moon rocks that have not been subjected to major shocks from later impacts - something that tends to erase all evidence of earlier magnetic fields. In fact, it's older than any known rocks from Mars or even from Earth.

"Many people think that it's the most interesting lunar rock," said Ben Weiss, the Victor P. Starr assistant professor of planetary sciences in MIT's Department of Earth, Atmospheric and Planetary Sciences. The rock was collected during the last lunar landing mission, Apollo 17, by Harrison "Jack" Schmidt, the only geologist to walk on the Moon.

"It is one of the oldest and most pristine samples known," said graduate student Ian Garrick-Bethell. "If that wasn't enough, it is also perhaps the most beautiful lunar rock, displaying a mixture of bright green and milky white crystals."

The team studied faint magnetic traces in a small sample of the rock in great detail. Using a commercial rock magnetometer that was specially fitted with an automated robotic system to take many readings "allowed us to make an order of magnitude more measurements than previous studies of lunar samples," Garrick-Bethell said. "This permitted us to study the magnetization of the rock in much greater detail than previously possible."

And the data enabled them to rule out the other possible sources of the magnetic traces, such as magnetic fields briefly generated by huge impacts on the Moon. Those magnetic fields are short lived, ranging from just seconds for small impacts up to one day for the most massive strikes. But the evidence written in the lunar rock showed it must have remained in a magnetic environment for a long period of time - millions of years - and thus the field had to have come from a long-lasting magnetic dynamo.

That's not a new idea, but it has been "one of the most controversial issues in lunar science," Weiss said. Until the Apollo missions, many prominent scientists were convinced that the Moon was born cold and stayed cold, never melting enough to form a liquid core. Apollo proved that there had been massive flows of lava on the Moon's surface, but the idea that it has, or ever had, a molten core remained controversial. "People have been vociferously debating this for 30 years," Weiss said.

The magnetic field necessary to have magnetized this rock would have been about one-fiftieth as strong as Earth's is today. Weiss said, "This is consistent with dynamo theory," and also fits in with the prevailing theory that the Moon was born when a Mars-sized body crashed into Earth and blasted much of its crust into space, where it clumped together to form the Moon.

The new finding underscores how much we still don't know about our nearest neighbor in space, which will soon be visited by humans once again under current NASA plans. "While humans have visited the Moon six times, we have really only scratched the surface when it comes to our understanding of this world," said Garick-Bethell.

Chandrayaan-1 peeks inside Moon craters


This image is a Mini-RF synthetic aperture radar (SAR) strip overlain on an Earth-based, Arecibo Observatory radar telescope image. Taken November 17, 2008, the south-polar SAR strip shows a part of the moon never seen before: a portion of Haworth crater that is permanently shadowed from Earth and the Sun. The only way to explore these regions is by using an orbital radar such as Mini-RF. ISRO/NASA/JHUAPL/LPI/Cornell University/Smithsonian

January 16, 2009

Using a NASA radar flying aboard India's Chandrayaan-1 spacecraft, scientists are getting their first look inside the Moon's coldest, darkest craters.

The Mini-SAR instrument, a lightweight, synthetic aperture radar, has passed its initial in-flight tests and sent back its first data. The images show the floors of permanently shadowed polar craters on the Moon that aren't visible from Earth. Scientists are using the instrument to map and search the insides of the craters for water ice.

"The only way to explore such areas is to use an orbital imaging radar such as Mini-SAR," said Benjamin Bussey, deputy principal investigator for Mini-SAR, from the Johns Hopkins University Applied Physics Laboratory in Laurel, Maryland. "This is an exciting first step for the team which has worked diligently for more than three years to get to this point."

The images, taken November 17, 2008, cover part of the Haworth crater at the Moon's south pole and the western rim of Seares crater, an impact feature near the north pole. Bright areas in each image represent either surface roughness or slopes pointing toward the spacecraft. Further data collection by Mini-SAR and analysis will help scientists to determine if buried ice deposits exist in the permanently shadowed craters near the Moon's poles.

Brown dwarfs aplenty in star-forming region


Tricolor composite image of W3 Main where massive stars are being born. Red colored objects to the left of center are extremely young massive stars, surrounded by less massive stars of one million years old. Nebulas with a variety of colors and appearances are ionized gas reflecting light from these stars. Filamentary dark clouds are also conspicuous. The line at bottom left shows a scale of 0.2 parsecs, which is approximately 40 thousand astronomical units. National Astronomical Observatory of Japan


January 29, 2009
Subaru Telescope facility, Hilo, Hawai


To explore dim, distant, low mass stars, a team of Japanese and Indian astronomers used the high sensitivity and spatial resolution of the Cooled Infrared Spectrograph and Camera for OHS (CISCO) at the Subaru Telescope in Hilo, Hawaii, to obtain unprecedented detailed data toward the W3 Main star forming region. W3 Main, located approximately 6,000 light-years away in the constellation Cassiopeia, is a very active and massive star-forming region. To date, this near-infrared image (at right) is the deepest and finest image from a ground-based telescope among the images of massive star forming regions. The deep and high-resolution image shows distinctive reddish and bluish nebulosity features, dark filaments between the diffuse nebulosities, and a significant population of faint stars in W3 Main.

The study has shown for the first time that there is a significant number of brown dwarfs in the W3 Main star forming region. This result is significantly different from that obtained in the cases of Trapezium and IC 348, where a decrease of relative population of brown dwarfs was found. The research findings indicate that a relative number of brown dwarfs may differ among regions in the galaxy. For the future, the team will proceed with the observations toward much more massive star forming regions in remote areas to study whether the results are widespread.

Superoutburst of the Dwarf Nova QZ Virginis


Dwarf Nova QZ Virginis
Annotated - Image Credit: Dr. Joe Brimacombe


AAVSO Locator Chart for QZ Vir

For all of you variable star fans, there's a new kid on the block - Dwarf Nova QZ Virginis. It was originally discovered by T. Meshkova on Moscow photographic plates in 1944 and had a magnitude range of 12.9 to as little as 14.5 But what is it? Try a cataclysmic variable star - one that our good friends down under caught just for Universe Today readers!

According to recently released AAVSO Special Notice #144, dwarf nova QZ Vir (once known as T Leo) is currently in outburst, and it appears that this outburst is a supermaximum. Says M. Templeton, "The most recent visual estimate of QZ Vir puts the star at visual magnitude 10.2 (JD 2454857.6201; W. Kriebel, Walkenstetten, Germany). Time series photometry by W. Stein (New Mexico, United States) on 2009 Jan 25 indicates the presence of superhumps in the light curve. Observations by P. Schmeer (Saarburecken-Bischmisheim, Germany), E. Morelle (Lauwin-Planque, France), ASAS-3 (Pojmanski 2002, AcA52, 397) and R. Stubbings (Tetoora Road, Vic., Australia) published on VSNET. (T. Kato; vsnet-alert 10980) suggest QZ Vir may have had a short precursor outburst lasting 2-3 days and fading immediately before the rise to supermaximum. All observations, including both visual estimates and CCD time-series photometry, are strongly encouraged at this time."

Of course, it didn't take a lot of encouragement - only some clear skies to get astrophotographer and serious researcher Joe Brimacombe of Southern Galactic to set his telescope towards QZ Virginis and image for us. All we needed to do was provide the following coordinates:
RA: 11 38 26.80 , Dec: +03 22 07.0

As you can see, learning proper stellar coordinates is essential to practicing astronomy. Without them, a stellar field is simply a stellar field as it would be next to impossible to distinguish one background star from the next. While some of us understand what these strange sets of numbers mean - maybe some of our readers don't. Let's take just a moment out from our busy days and learn, shall we?

RA stands for Right Ascension. It is the celestial equivalent of terrestrial longitude. RA's zero point is the Prime Meridian, located in the constellation of Aries where the Sun crosses the celestial equator at the March equinox. Each set of numbers is then measured eastward in three sets - hours, minutes, and seconds, with 24 hours being equivalent to a full circle. Declination, or "Dec" is comparable to latitude, projected onto the celestial sphere, and is measured in degrees north and south of the celestial equator. Points north of the celestial equator have positive declinations, while those to the south have negative declinations. These are also measured in three sets of numbers - degrees, minutes, and seconds of arc.

Now that you know, how do you use them? Chances are, if you have a telescope that has an equatorial mount, you already have the tools in your hands - called "setting circles". These same sets of numbers are waiting right on your telescope for you to set them! Once your telescope is accurately polar aligned, you just use the setting circles to dial in these numbers and you'll be right in the approximate area. For those with electronic setting circles, it's just a matter of inputting the correct coordinates and comparing star fields. Once the general area is found, you simply need to understand how big the field your eyepiece gives and compare it to a star chart - like this one supplied by the AAVSO for QZ Vir.

Make note of your observations and compare the suspect nova to other stars of known magnitude nearby. When you're done - don't keep your observations to yourself! Please report all observations to the AAVSO using the name "QZ Vir" and contribute!

NGC 604 - Wall Divides East and West Sides of Cosmic Metropolis


Credit X-ray: NASA/CXC/CfA/R. Tuellmann et al.;
Optical: NASA/AURA/STScI


A new study unveils NGC 604, the largest region of star formation in the nearby galaxy M33, in its first deep, high-resolution view in X-rays. This composite image from Chandra X-ray Observatory data (colored blue), combined with optical light data from the Hubble Space Telescope (red and green), shows a divided neighborhood where some 200 hot, young, massive stars reside.

Throughout the cosmic metropolis, giant bubbles in the cool dust and warm gas are filled with diffuse, multi-million degree gas that emits X-rays. Scientists think these bubbles are generated and heated to X-ray temperatures when powerful stellar winds from the young massive stars collide and push aside the surrounding gas and dust. So, the vacated areas are immediately repopulated with the hotter material seen by Chandra.

However, there is a difference between the two sides of this bifurcated stellar city. (Rollover the image above or view this separate annotated image for the location of the "wall".) On the western (right) side, the amount of hot gas found in the bubbles corresponds to about 4300 times the mass of the sun. This value and the brightness of the gas in X-rays imply that the western part of NGC 604 is entirely powered by winds from the 200 hot massive stars.

This result is interesting because previous modeling of other bubbles usually predicted them to be fainter than observed, so that additional heating from supernova remnants is required. The implication is that in this area of NGC 604, none or very few of the massive stars must have exploded as supernovas.

The situation is different on the eastern (left) side of NGC 604. On this side, the X-ray gas contains 1750 times the mass of the sun and winds from young stars cannot explain the brightness of the X-ray emission. The bubbles on this side appear to be much older and were likely created and powered by young stars and supernovas in the past.

A similar separation between east and west is seen in the optical results. This implies that a massive wall of gas shields the relatively quiet region in the east from the active star formation in the west.

This study was led by Ralph Tuellmann of the Harvard Smithsonian Center for Astrophysics and was part of a very deep, 16-day long observation of M33 called the Chandra ACIS Survey of M33, or ChASeM33.

Astronomers Observe Planet with Wild Temperature Swings


Tour of Planet with Extreme Temperature Swings
Credit: NASA/JPL-Caltech/D. Kasen (UC Santa Cruz)


This image shows a computer simulation of the planet HD 80606b from an observer located at a point in space lying between the Earth and the HD 80606 system. The animation starts 2.2 days before the moment of close approach and ends 8.9 days later. The blue areas are reflected starlight (the blue color arises mainly from absorption by sodium and potassium in the planetary atmosphere). Red regions are areas of the planet that are glowing with their own intrinsic heat.The point of closest approach -- and maximum heating -- occurs about 4.5 seconds into the animation. As the planet whips around the star, we see the evolving thermal storm patterns across its unilluminated side. The planetÍs transit behind its star (as would be seen from Earth four seconds into the animation) is not shown in this simulation.These theoretical models allow astronomers to better understand weather patterns on distant planets. While direct telescopic observations of the atmospheres of such worlds may be many decades away, such simulations give us a clue to what we may see when it becomes possible.


Light From Red-Hot Planet
Credit: NASA/JPL-Caltech/G. Laughlin (UC Santa Cruz)


This figure charts 30 hours of observations taken by NASA's Spitzer Space Telescope of a strongly irradiated exoplanet (an planet orbiting a star beyond our own). Spitzer measured changes in the planet's heat, or infrared light.The lower graph shows precise measurements of infrared light with a wavelength of 8 microns coming from the HD 80606 stellar system. The system consists of a sun-like star and a planetary companion on an extremely eccentric, comet-like orbit. The geometry of the planet-star encounter is shown in the upper part of the figure.As the planet swung through its closest approach to the star, the Spitzer observations indicated that it experienced very rapid heating (as shown by the red curve). Just
before close approach, the planet was eclipsed by the star as seen from Earth, allowing astronomers to determine the amount of energy coming from the planet in comparison to the amount coming from the star.The observations were made in Nov. of 2007, using Spitzer's infrared array camera. They represent a significant first for astronomers, opening the door to studying changes in atmospheric conditions of planets far beyond our own solar system.


Severe Exoplanetary Storm
Credit: NASA/JPL-Caltech/J. Langton (UC Santa Cruz)


These computer-generated images chart the development of severe weather patterns on the highly eccentric exoplanet HD 80606b during the days after its closest approach to its parent star. An exoplanet is a planet that orbits a star other than our sun.
The images were produced by computer simulations that modeled NASA's Spitzer
Space Telescope's measurements of heat radiating from the planet. The six frames are evenly spaced in time, starting from 4.4 days after the planet's close approach to the star, a moment known as "periastron," and running through 8.9 days after periastron. The blue glow of the crescent is starlight that has been scattered and reflected by the planet. The starlight appears blue because the planet is a very efficient absorber of red light. The night side appears reddish orange as it glows with its own internal heat.These theoretical models allow astronomers to better understand weather patterns on distant planets. While direct telescopic observations of the atmospheres of such worlds may be many decades away, such simulations give us a clue to what we may see when it becomes possible.The Spitzer observations themselves spanned the relatively brief period when the heating of the planet was most intense, running from 20 hours prior to 10 hours after periastron. The data were taken in Nov. of 2007.HD 80606b is located 190 light-years away in the constellation Ursa Major. Its star can be seen with binoculars.

Wednesday, January 28, 2009

NASA's Spitzer Space Telescope has observed a planet that heats up to red-hot temperatures in a matter of hours before quickly cooling back down.

The "hot-headed" planet is HD 80606b, a gas giant that orbits a star 190 light-years from Earth. It was already known to be quite unusual, with an orbit shuttling it nearly as far out as Earth is from our sun, and much closer in than our planet Mercury. Astronomers used Spitzer, an infrared observatory, to measure heat emanating from the planet as it whipped behind and close to its star. In just six hours, the planet's temperature rose from 800 to 1,500 Kelvin (980 to 2,240 degrees Fahrenheit).

"We watched the development of one of the fiercest storms in the galaxy," said astronomer Greg Laughlin of the Lick Observatory, University of California at Santa Cruz. "This is the first time that we've detected weather changes in real time on a planet outside our solar system." Laughlin is lead author of a new report about the discovery appearing in the Jan. 29 issue of Nature.

HD 80606b was originally discovered in 2001 by a Swiss planet-hunting team led by Dominique Naef of the Geneva Observatory in Switzerland. Using a method known as the Doppler-velocity technique, the astronomers learned that the planet is wildly eccentric, with an orbit more like a comet's than a planet's. HD 80606b's orbit takes it as far out as 0.85 astronomical units from its star, and as close in as 0.03 astronomical units (one astronomical unit is the distance between Earth and the sun).

The planet takes about 111 days to circle its star, but it spends most of its time at farther distances while zipping through the closest part of its orbit in less than a day. (This is a consequence of Kepler's Second Law of Planetary Motion, which states that orbiting bodies -- planets and comets -- sweep out an equal area in equal time.)

"If you could float above the clouds of this planet, you'd see its sun growing larger and larger at faster and faster rates, increasing in brightness by almost a factor of 1,000," said Laughlin.

Spitzer observed HD 80606b before, during and just after its closest passage to the star in November of 2007, as the planet sizzled under the star's heat. When Laughlin and his colleagues planned the observation, they did not know whether the planet would disappear completely behind the star, an event called a secondary eclipse, or whether it would remain in view. Luckily for the team, the planet did indeed temporarily disappear from view, providing the planet's initial and final temperatures (had the planet had not been eclipsed, the team would have known only the temperature change without knowing the starting point).

The extreme temperature swing observed by Spitzer indicates that the air near the planet's gaseous surface must quickly absorb and lose heat. This type of atmospheric information revealing how a planet responds to sudden changes in heating -- an extreme version of seasonal change -- had never been obtained before for any exoplanet (a planet orbiting another star).

"By studying this planet under such extreme circumstances, we figure out how it handles heat -- does it retain it or dissipate it? In this case, the answer is that the planet releases the heat right away," said Laughlin. "We were essentially able to perform the 'thought experiment' -- what would happen to a planet like Jupiter if we could drag it very close to the sun?"

Laughlin and his colleagues say that a key factor in being able to make the observations is the planet's eccentric orbit. Unlike so-called hot Jupiter planets that remain in tight orbits around their stars, HD 80606b rotates around its axis roughly every 34 hours. Hot Jupiters, on the other hand, are thought to be tidally locked like our moon, so one side always faces their stars. Because HD 80606b spins on its axis many times per orbit, the astronomers were able to measure how its atmosphere responds to being baked by the star.

"The planet is spinning at a fast enough rate for the planet's hot spot to come into view," said co-author Drake Deming of NASA's Goddard Space Flight Center, Greenbelt, Md. "The hot spot can't hide."

Amateur and professional astronomers alike are gearing up to observe HD 80606b this coming Valentine's Day, when it will swing around the front of its star. There's a 15 percent chance that the planet will eclipse its star, an event known as the primary transit. If so, the event would not only be remarkable to see, but would also provide more details about the nature of this temperamental world.

Other authors include Jonathan Langton, Daniel Kasen, Steve Vogt, Eugenio Rivera and Stefano Meschiari from the University of California, Santa Cruz, and Paul Butler of the Carnegie Institution's Department of Terrestrial Magnetism, Washington. NASA's Jet Propulsion Laboratory, Pasadena, Calif., manages the Spitzer Space Telescope mission for NASA's Science Mission Directorate, Washington. Science operations are conducted at the Spitzer Science Center at the California Institute of Technology, also in Pasadena. Caltech manages JPL for NASA.

Black hole outflows from Centaurus A detected with APEX


About this image:

Colour composite image of Centaurus A, revealing the lobes and jets emanating from the active galaxy’s central black hole. This is a composite of images obtained with three instruments, operating at very different wavelengths. The 870-micron submillimetre data, from LABOCA on APEX, are shown in orange. X-ray data from the Chandra X-ray Observatory are shown in blue. Visible light data from the Wide Field Imager (WFI) on the MPG/ESO 2.2 m telescope located at La Silla, Chile, show the background stars and the galaxy’s characteristic dust lane in close to "true colour".
Credit: ESO/WFI (Optical); MPIfR/ESO/APEX/A.Weiss et al. (Submillimetre); NASA/CXC/CfA/R.Kraft et al. (X-ray)

Astronomers have a new insight into the active galaxy Centaurus A (NGC 5128), as the jets and lobes emanating from the central black hole have been imaged at submillimetre wavelengths for the first time. The new data, from the Atacama Pathfinder Experiment (APEX) telescope in Chile, which is operated by ESO, have been combined with visible and X-ray wavelengths to produce this striking new image.

Centaurus A is our nearest giant galaxy, at a distance of about 13 million light-years in the southern constellation of Centaurus. It is an elliptical galaxy, currently merging with a companion spiral galaxy, resulting in areas of intense star formation and making it one of the most spectacular objects in the sky. Centaurus A hosts a very active and highly luminous central region, caused by the presence of a supermassive black hole (see ESO 04/01), and is the source of strong radio and X-ray emission.

In the image, we see the dust ring encircling the giant galaxy, and the fast-moving radio jets ejected from the galaxy centre, signatures of the supermassive black hole at the heart of Centaurus A. In submillimetre light, we see not only the heat glow from the central dust disc, but also the emission from the central radio source and – for the first time in the submillimetre – the inner radio lobes north and south of the disc. Measurements of this emission, which occurs when fast-moving electrons spiral around the lines of a magnetic field, reveal that the material in the jet is travelling at approximately half the speed of light. In the X-ray emission, we see the jets emerging from the centre of Centaurus A and, to the lower right of the galaxy, the glow where the expanding lobe collides with the surrounding gas, creating a shockwave.

The Large APEX Bolometer Camera (LABOCA), built by the Max-Planck-Institute for Radio Astronomy (MPIfR), is mounted on APEX, a 12-metre diameter submillimetre-wavelength telescope located on the 5000 m high plateau of Chajnantor in the Chilean Atacama region. APEX is a collaboration between the MPIfR, the Onsala Space Observatory and ESO. The telescope is based on a prototype antenna constructed for the next generation Atacama Large Millimeter/submillimeter Array (ALMA) project. Operation of APEX at Chajnantor is entrusted to ESO.

A Twist on the "Trunk"


IC1396 and Van den Berg 142 by Takayuki Yoshida

Out in the reaches of the constellation of Cepheus some 2400 light years from Earth, a cloud of hydrogen gas and dust harbors young star cluster IC 1396. These newborn stars emit their light upon the scene… shedding infrared radiation through a 20 light year wide corridor known as the "Elephant's Trunk"…

Cataloged by Dreyer as far back as 1888, galactic cluster IC 1396 has long been known to have an air of nebulosity around it and perhaps a shroud of mystery as well. As telescopes improved, so did the view and observers began to notice dark patches and a bright, sinuous rim. The dark interstellar clouds took a very special observer in the late 1800s to discover them - E.E. Barnard - and he labeled his discovery B163. Nothing more than a cold area in space - obscuring dust waiting to gel into stars. Just another dark hole obscuring a mystery inside IC 1396… and tiny patch of nebula that would one day be known as Van den Berg 142.

In 1975 Robert B. Loren (et al) was the first to report on the molecular cloud structure in IC 1396. His observations were made using the Kitt Peak scope, doing their best to confirm the hypothesis that cometary like structure was the result of an ionization front as it progressed into neutral hydrogen territory. High density gases, a dark rimmed nebula… But, they still didn't quite grasp what lay inside - a concentration of interstellar gas and dust that is being illuminated and ionized by a very bright, massive star.

And the tiny dense globules hiding from the intense ultraviolet rays…

In 1996, G. H. Moriarty Schieven was the first to announce H I "Tails" from cometary globules in IC 1396. In his reports he writes: "IC 1396 is a relatively nearby, large, H ii region ionized by a single O6.5 V star and containing bright rimmed cometary globules. We have made the first arcminute resolution images of atomic hydrogen toward IC 1396, and have found remarkable "tail" like structures associated with some of the globules and extending up to 6.5 pc radially away from the central ionizing star. These H i "tails" may be material which has been ablated from the globule through ionization and/or photodissociation and then accelerated away from the globule by the stellar wind, but which has since drifted into the "shadow" of the globules." This report was the first results of the Galactic Plane Survey Project began by the Dominion Radio Astrophysical Observatory and opened the gateway into the twisted tale of the "Trunk".

The Elephant's Trunk nebula is an intense concentration of interstellar gas which contains embedded globule IC 1396A and is now believed to be the site of star formation. Located inside the opening where the stellar winds have cleared a cavity are two very young stars - their pressure driving the material outwards and revealing the presence of protostars.

In 2003, Alaina Henry picked up the ball once again. "Since emission line stars are relatively rare, the discovery of a cluster of emission line stars is adequate proof that star formation is taking place in a cluster. In addition, young stars often display variable luminosity. It is thought that non-constant mass accretion rates cause variations in the luminosity of young stellar objects. BRC 37 is a small globule in the extended, HII region, IC 1396. It is about I' wide and 5' long in the optical, and has a bright rim of Ho emission in the north, due to recombination of ionized hydrogen. The source of the ionization is thought to be the 06 star, HO 206267, which lies several degrees away on the sky. The infrared source, IRAS 21388+5622 is located at the head of the globule and showed another signature of star formation in BRC 37 by discovering a bipolar molecular outflow associated with the IRAS source. We identify eight likely young stellar objects in BRC 37, based on the presence of an infrared excess. We also identify four of our observed sources with Ho emission line stars. Of these 11 sources, five are sub-stellar objects, below the hydrogen burning limit. While the eleven objects in table 1 are apparently young stellar objects, it is likely that there are many more young stellar objects in BRC 37… "

As recently as mid-2005 even more discovery was made by Astrofisico di Arcetri at the end of a 16 year study. "In spite of the relatively high far-infrared luminosities of the embedded sources H2O maser emission was detected towards three globules only. Since the occurrence of water masers is higher towards bright IRAS sources, the lack of frequent H2O maser emission is somewhat surprising if the suggestion of induced intermediate- and high-mass star formation within these globules is correct. The maser properties of two BRCs are characteristic of exciting sources of low-mass, while the last one (BRC 38) is consistent with an intermediate-mass object."
Around 18 months later at the beginning of 2007, Konstantin V. Getman (et al) used the Chandra X-Ray Observatory to draw conclusions on this same strange area as well: "The IC 1396N cometary globule (CG) within the large nearby H II region IC 1396 has been observed with the ACIS detector on board the Chandra X-Ray Observatory. We detect 117 X-ray sources, of which ~50-60 are likely members of the young open cluster Trumpler 37 dispersed throughout the H II region, and 25 are associated with young stars formed within the globule…. We find that the Chandra source associated with the luminous Class 0/I protostar IRAS 21391+5802 is one of the youngest stars ever detected in the X-ray band."

Is there even more things yet to be discovered inside the twisted "Trunk"? Astronomers haven't stopped looking. Just as recently as November 2008 yet another study was released Zoltan Bolag (et al) searching for protoplanetary discs. "Overall, our observations support theoretical predictions in which photoevaporation removes the gas relatively quickly (<=105 yr) from the outer region of a protoplanetary disk, but leaves an inner, more robust, and possibly gas-rich disk component of radius 5-10 AU. With the gas gone, larger solid bodies in the outer disk can experience a high rate of collisions and produce elevated amounts of dust. This dust is being stripped from the system by the photon pressure of the O star to form a gas-free dusty tail." What will the future hold? My many thanks to Takayuki Yoshida of Northern Galactic for turning me on to this incredible image which sparked my desire to learn and share what I'd learned about this region. Arigato!

Transit Search Finds Super-Neptune


This artist's conception reveals the newly discovered Super-Neptune planet orbiting a star 120 light years away from Earth. Normally blue in color, its red hue is caused by the illumination from the nearby Red Dwarf star. Credit: David A. Aguilar (CfA)

Tuesday, January 20, 2009

Astronomers at the Harvard-Smithsonian Center for Astrophysics have discovered a planet somewhat larger and more massive than Neptune orbiting a star 120 light-years from Earth. While Neptune has a diameter 3.8 times that of Earth and a mass 17 times Earth's, the new world (named HAT-P-11b) is 4.7 times the size of Earth and has 25 Earth masses.

HAT-P-11b was discovered because it passes directly in front of (transits) its parent star, thereby blocking about 0.4 percent of the star's light. This periodic dimming was detected by a network of small, automated telescopes known as "HATNet," which is operated by the Center in Arizona and Hawaii. HAT-P-11b is the 11th extrasolar planet found by HATNet, and the smallest yet discovered by any of the several transit search projects underway around the world.

Transit detections are particularly useful because the amount of dimming tells the astronomers how big the planet must be. By combining transit data with measurements of the star's "wobble" (radial velocity) made by large telescopes like Keck, astronomers can determine the mass of the planet.

A number of Neptune-like planets have been found recently by radial velocity searches, but HAT-P-11b is only the second Neptune-like planet found to transit its star, thus permitting the precise determination of its mass and radius.

The newfound world orbits very close to its star, revolving once every 4.88 days. As a result, it is baked to a temperature of around 1100 degrees F. The star itself is about three-fourths the size of our Sun and somewhat cooler.

There are signs of a second planet in the HAT-P-11 system, but more radial velocity data are needed to confirm that and determine its properties.

Another team has located one other transiting super-Neptune, known as GJ436b, around a different star. It was discovered by a radial velocity search and later found to have transits.

"Having two such objects to compare helps astronomers to test theories of planetary structure and formation," said Harvard astronomer Gaspar Bakos, who led the discovery team.

HAT-P-11 is in the constellation Cygnus, which puts in it the field of view of NASA's upcoming Kepler spacecraft. Kepler will search for extrasolar planets using the same transit technique pioneered by ground-based telescopes. This mission potentially could detect the first Earth-like world orbiting a distant star. "In addition, however, we expect Kepler to measure the detailed properties of HAT-P-11 with the extraordinary precision possible only from space," said Robert Noyes, another member of the discovery team.

Headquartered in Cambridge, Mass., the Harvard-Smithsonian Center for Astrophysics (CfA) is a joint collaboration between the Smithsonian Astrophysical Observatory and the Harvard College Observatory. CfA scientists, organized into six research divisions, study the origin, evolution and ultimate fate of the universe.

Cornell-led team detects dust around a primitive star, shedding new light on universe's origins


Palomar Digitized Sky Survey
The Sculptor Dwarf galaxy,
with the position of carbon star MAG 29 noted.

Friday, January 16, 2009

A Cornell-led team of astronomers has observed dust forming around a dying star in a nearby galaxy, giving a glimpse into the early universe and enlivening a debate about the origins of all cosmic dust.

The findings are reported in the Jan. 16 issue of the journal Science (Vol. 323, No. 5912). Cornell research associate Greg Sloan led the study, which was based on observations with NASA's Spitzer Space Telescope. The researchers used Spitzer's Infrared Spectrograph, which was developed at Cornell.

Dust plays a key role in the evolution of such galaxies as our Milky Way. Stars produce dust -- rich with carbon or oxygen -- as they die. But less is known about how and what kind of dust was created in galaxies as they formed soon after the big bang.

Sloan and his colleagues observed dust forming around the carbon star MAG 29, located 280,000 light years away in a smaller nearby galaxy called the Sculptor Dwarf. Stars more massive than the sun end their lives as carbon stars, which in our galaxy are a rich source of dust.

The Sculptor Dwarf contains only 4 percent of the carbon and other heavy elements in our own galaxy, making it similar to primitive galaxies seen at the edge of the universe. Those galaxies emitted the light we now see soon after they and the universe formed.

"What this tells us is that carbon stars could have been pumping dust soon after the first galaxies were born," Sloan said.

Scientists have debated where the dust in the early universe comes from. Supernovae have been a favorite suspect, but they may destroy more dust than they create.

"While everyone is focused on the questions of how much and what kind of dust supernovae make, they may not have appreciated that carbon stars can make at least some of the dust we are seeing," Sloan said. "The more we can understand the quantity and composition of the dust, the better we can understand how stars and galaxies evolve, both in the early universe and right next door."

Observing such stars as MAG 29 is not unlike using a time machine, Sloan said, in which astronomers can catch glimpses of what the universe looked like billions of years ago.

"We haven't seen carbon-rich dust in this primitive of an environment before," Sloan said.

The study is co-authored by J. Bernard Salas, a Cornell postdoctoral associate, and scientists in Japan, England, Australia and Belgium. It is part of a project led by Albert Zijlstra at the University of Manchester in England.

New study resolves mystery of how massive stars form


Volume renderings of the density field in a region of the simulation at 55,000 years of evolution. The left panel shows a polar view, and the right panel shows an equatorial view. The fingers feeding the equatorial disk are clearly visible.


Computer simulation of the formation of a massive star yielded these snapshots showing stages in the process over time. Panels on the left represent a polar view (the axis of rotation is perpendicular to the plane of the image), and panels on the right represent an equatorial view. Plus signs indicate projected positions of stars. Colors represent density.

Theorists have long wondered how massive stars--up to 120 times the mass of the Sun--can form without blowing away the clouds of gas and dust that feed their growth. But the problem turns out to be less mysterious than it once seemed. A study published this week by Science shows how the growth of a massive star can proceed despite outward-flowing radiation pressure that exceeds the gravitational force pulling material inward.

The new findings also explain why massive stars tend to occur in binary or multiple star systems, said lead author Mark Krumholz, an assistant professor of astronomy and astrophysics at the University of California, Santa Cruz. The formation of companion stars emerged unexpectedly from the sophisticated computer simulations the researchers used to explore the physics of massive star formation.

"We didn't set out to solve that question, so it was a nice side benefit of the study," Krumholz said. "The main finding is that radiation pressure does not limit the growth of massive stars."

Radiation pressure is the force exerted by electromagnetic radiation on the surfaces it strikes. This effect is negligible for ordinary light, but it becomes significant in the interiors of stars due to the intensity of the radiation. In massive stars, radiation pressure is the dominant force counteracting gravity to prevent the further collapse of the star.

"When you apply the radiation pressure from a massive star to the dusty interstellar gas around it, which is much more opaque than the star's internal gas, it should explode the gas cloud," Krumholz said. Earlier studies suggested that radiation pressure would blow away the raw materials of star formation before a star could grow much larger than about 20 times the mass of the Sun. Yet astronomers observe stars much more massive than that.

Krumholz and his coauthors at UC Berkeley and Lawrence Livermore National Laboratory have spent years developing complex computer codes for simulating the processes of star formation. Combined with advances in computer technology, their latest software (called ORION) enabled them to run a detailed three-dimensional simulation of the collapse of an enormous interstellar gas cloud to form a massive star. The project required months of computing time at the San Diego Supercomputer Center.

The simulation showed that as the dusty gas collapses onto the growing core of a massive star, with radiation pressure pushing outward and gravity pulling material in, instabilities develop that result in channels where radiation blows out through the cloud into interstellar space, while gas continues falling inward through other channels.

"You can see fingers of gas falling in and radiation leaking out between those fingers of gas," Krumholz said. "This shows that you don't need any exotic mechanisms; massive stars can form through accretion processes just like low-mass stars."

The rotation of the gas cloud as it collapses leads to the formation of a disk of material feeding onto the growing "protostar." The disk is gravitationally unstable, however, causing it to clump and form a series of small secondary stars, most of which end up colliding with the central protostar. In the simulation, one secondary star became massive enough to break away and acquire its own disk, growing into a massive companion star. A third small star formed and was ejected into a wide orbit before falling back in and merging with the primary star.

When the researchers stopped the simulation, after allowing it to evolve for 57,000 years of simulated time, the two stars had masses of 41.5 and 29.2 times the mass of the Sun and were circling each other in a fairly wide orbit.

"What formed in the simulation is a common configuration for massive stars," Krumholz said. "I think we can now consider the mystery of how massive stars are able to form to be solved. The age of supercomputers and the ability to simulate the process in three dimensions made the solution possible."

The paper describing these results is being published by Science on the Science Express web site on January 15, 2009. In addition to Krumholz, the coauthors are Richard Klein, Christopher McKee, and Stella Offner of UC Berkeley, and Andrew Cunningham of Lawrence Livermore National Laboratory.

Martian Methane Reveals the Red Planet is not a Dead Planet


This image shows concentrations of Methane discovered on Mars.
Credit: NASA


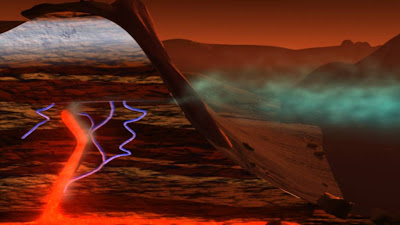
Scientists don't yet know enough to say with certainty what the source of the Martian methane is, but this artist's concept depicts a possibility. In this illustration, subsurface water, carbon dioxide and the planet's internal heat combine to release methane. Although we don’t have evidence on Mars of active volcanoes today, ancient methane trapped in ice "cages" might now be released. Credit: NASA/Susan Twardy

Thursday, January 15, 2009

Mars today is a world of cold and lonely deserts, apparently without life of any kind, at least on the surface. Worse still, it looks like Mars has been cold and dry for billions of years, with an atmosphere so thin, any liquid water on the surface quickly boils away while the sun's ultraviolet radiation scorches the ground.

But there is evidence of a warmer and wetter past -- features resembling dry riverbeds and minerals that form in the presence of water indicate water once flowed through Martian sands. Since liquid water is required for all known forms of life, scientists wonder if life could have risen on Mars, and if it did, what became of it as the Martian climate changed.

New research reveals there is hope for Mars yet. The first definitive detection of methane in the atmosphere of Mars indicates the planet is still alive, in either a biologic or geologic sense, according to a team of NASA and university scientists.

"Methane is quickly destroyed in the Martian atmosphere in a variety of ways, so our discovery of substantial plumes of methane in the northern hemisphere of Mars in 2003 indicates some ongoing process is releasing the gas," said Dr. Michael Mumma of NASA's Goddard Space Flight Center in Greenbelt, Md. "At northern mid-summer, methane is released at a rate comparable to that of the massive hydrocarbon seep at Coal Oil Point in Santa Barbara, Calif.

" Methane -- four atoms of hydrogen bound to a carbon atom -- is the main component of natural gas on Earth. It's of interest to astrobiologists because organisms release much of Earth's methane as they digest nutrients. However, other purely geological processes, like oxidation of iron, also release methane. "Right now, we don’t have enough information to tell if biology or geology -- or both -- is producing the methane on Mars," said Mumma. "But it does tell us that the planet is still alive, at least in a geologic sense. It's as if Mars is challenging us, saying, hey, find out what this means." Mumma is lead author of a paper on this research appearing in Science Express Jan. 15.

If microscopic Martian life is producing the methane, it likely resides far below the surface, where it's still warm enough for liquid water to exist. Liquid water, as well as energy sources and a supply of carbon, are necessary for all known forms of life.

"On Earth, microorganisms thrive 2 to 3 kilometers (about 1.2 to 1.9 miles) beneath the Witwatersrand basin of South Africa, where natural radioactivity splits water molecules into molecular hydrogen (H2) and oxygen. The organisms use the hydrogen for energy. It might be possible for similar organisms to survive for billions of years below the permafrost layer on Mars, where water is liquid, radiation supplies energy, and carbon dioxide provides carbon," said Mumma.

"Gases, like methane, accumulated in such underground zones might be released into the atmosphere if pores or fissures open during the warm seasons, connecting the deep zones to the atmosphere at crater walls or canyons," said Mumma.

"Microbes that produced methane from hydrogen and carbon dioxide were one of the earliest forms of life on Earth," noted Dr. Carl Pilcher, Director of the NASA Astrobiology Institute which partially supported the research. "If life ever existed on Mars, it's reasonable to think that its metabolism might have involved making methane from Martian atmospheric carbon dioxide."

However, it is possible a geologic process produced the Martian methane, either now or eons ago. On Earth, the conversion of iron oxide (rust) into the serpentine group of minerals creates methane, and on Mars this process could proceed using water, carbon dioxide, and the planet's internal heat. Although we don’t have evidence on Mars of active volcanoes today, ancient methane trapped in ice "cages" called clathrates might now be released.

The team found methane in the atmosphere of Mars by carefully observing the planet over several Mars years (and all Martian seasons) with NASA's Infrared Telescope Facility, run by the University of Hawaii, and the W. M. Keck telescope, both at Mauna Kea, Hawaii. The team used spectrometer instruments attached to the telescopes to make the detection. Spectrometers spread light into its component colors, like a prism separates white light into a rainbow.

The team looked for dark areas in specific places along the rainbow (light spectrum) where methane was absorbing sunlight reflected from the Martian surface. They found three such areas, called absorption lines, which together are a definitive signature of methane, according to the team. They were able to distinguish lines from Martian methane from the methane in Earth's atmosphere because the motion of the Red Planet shifted the position of the Martian lines, much as a speeding ambulance causes its siren to change pitch as it passes by.

"We observed and mapped multiple plumes of methane on Mars, one of which released about 19,000 metric tons of methane," said Dr. Geronimo Villanueva of the Catholic University of America, Washington, D.C. Villanueva is stationed at NASA Goddard and is co-author of the paper. "The plumes were emitted during the warmer seasons -- spring and summer -- perhaps because the permafrost blocking cracks and fissures vaporized, allowing methane to seep into the Martian air. Curiously, some plumes had water vapor while others did not," said Villanueva.

According to the team, the plumes were seen over areas that show evidence of ancient ground ice or flowing water. For example, plumes appeared over northern hemisphere regions such as east of Arabia Terra, the Nili Fossae region, and the south-east quadrant of Syrtis Major, an ancient volcano 1,200 kilometers (about 745 miles) across.

It will take future missions, like NASA's Mars Science Laboratory, to discover the origin of the Martian methane. One way to tell if life is the source of the gas is by measuring isotope ratios. Isotopes are heavier versions of an element; for example, deuterium is a heavier version of hydrogen. In molecules that contain hydrogen, like water and methane, the rare deuterium occasionally replaces a hydrogen atom. Since life prefers to use the lighter isotopes, if the methane has less deuterium than the water released with it on Mars, it's a sign that life is producing the methane. The research was funded by NASA's Planetary Astronomy Program and the NASA Astrobiology Institute.

Wednesday, January 21, 2009

Frantic Activity Revealed in Dusty Stellar actories


Thanks to the Very Large Telescope's acute and powerful near-infrared eye, astronomers have uncovered a host of new young, massive and dusty stellar nurseries in nearby galaxy NGC 253. The centre of this galaxy appears to harbour a twin of our own Milky Way's supermassive black hole.

ESO PR Photo 02a/09
Credit: ESO

January 19, 2009

Astronomers from the Instituto de Astrofísica de Canarias (Spain) used NACO, a sharp-eyed adaptive optics instrument on ESO's Very Large Telescope (VLT), to study the fine detail in NGC 253, one of the brightest and dustiest spiral galaxies in the sky. Adaptive Optics (AO) corrects for the blurring effect introduced by the Earth's atmosphere. This turbulence causes the stars to twinkle in a way that delights poets, but frustrates astronomers, since it smears out the images. With AO in action the telescope can produce images that are as sharp as is theoretically possible, as if the telescope were in space.

NACO revealed features in the galaxy that were only 11 light-years across. "Our observations provide us with so much spatially resolved detail that we can, for the first time, compare them with the finest radio maps for this galaxy — maps that have existed for more than a decade," says Juan Antonio Fernández-Ontiveros, the lead author of the paper reporting the results [1].

Astronomers identified 37 distinct bright regions, a threefold increase on previous results, packed into a tiny region at the core of the galaxy, comprising just one percent of the galaxy's total size. The astronomers combined their NACO images with data from another VLT instrument, VISIR, as well as with images from the NASA/ESA Hubble Space Telescope and radio observations made by the Very Large Array and the Very Large Baseline Interferometer. Combining these observations, taken in different wavelength regimes, provided a clue to the nature of these regions.

"We now think that these are probably very active nurseries that contain many stars bursting from their dusty cocoons," says Jose Antonio Acosta-Pulido, a member of the team. NGC 253 is known as a starburst galaxy, after its very intense star formation activity. Each bright region could contain as many as one hundred thousand young, massive stars.

This comprehensive set of data also leads astronomers to conclude that the centre of NGC 253 hosts a scaled-up version of Sagittarius A*, the bright radio source that lies at the core of the Milky Way and which we know harbours a massive black hole (see ESO 46/08). "We have thus discovered what could be a twin of our Galaxy's Centre," says co-author Almudena Prieto.

Hubble Snaps Images of a Nebula Within a Cluster


Credit: NASA, ESA, and the Hubble Heritage Team (STScI/AURA)

The unique planetary nebula NGC 2818 is nested inside the open star cluster NGC 2818A. Both the cluster and the nebula reside over 10,000 light-years away, in the southern constellation Pyxis (the Compass).

NGC 2818 is one of very few planetary nebulae in our galaxy located within an open cluster. Open clusters, in general, are loosely bound and they disperse over hundreds of millions of years. Stars that form planetary nebulae typically live for billions of years. Hence, it is rare that an open cluster survives long enough for one of its members to form a planetary nebula. This open cluster is particularly ancient, estimated to be nearly one billion years old.

The spectacular structure of NGC 2818 (also known as PLN 261+8.1) contains the outer layers of a sun-like star that were sent off into interstellar space during the star's final stages of life. These glowing gaseous shrouds were shed by the star after it ran out of fuel to sustain the nuclear reactions in its core.

Planetary nebulae can have extremely varied structures. NGC 2818 has a complex shape that is difficult to interpret. However, because of its location within the cluster, astronomers have access to information about the nebula, such as its age and distance, that might not otherwise be known.

Planetary nebulae fade away gradually over tens of thousands of years. The hot, remnant stellar core of NGC 2818 will eventually cool off for billions of years as a white dwarf. Our own sun will undergo a similar process, but not for another 5 billion years or so.

This Hubble image was taken in November 2008 with the Wide Field Planetary Camera 2. The colors in the image represent a range of emissions coming from the clouds of the nebula: red represents nitrogen, green represents hydrogen, and blue represents oxygen.

Astronomers Observe Heat From Hot Jupiter


TrES-3b is a gas giant like Jupiter, but with an orbit much closer to its star than Mercury is to our Sun. That puts it into the category of "hot jupiter" planets. This graphic illustrates the concept of a "hot jupiter". Credit: Leiden Observatory.


This image shows a comparison between the sizes of the orbits of TrES-3b and Mercury around the primary star. Note that while the orbits are to scale, the sizes of the planets and the star are not.


This image shows the star eclipsing the planet. As the planet disappears behind the star, the light coming from the whole system decreases because of the absence of the planet's light. This allows for precise measurements of the light emitted by the planet.

January 13, 2009

Two teams of astronomers have measured light emitted from extrasolar planets around sun-like stars for the first time ever using ground-based telescopes. These results were obtained simultaneously and independently by the two teams for two different planets. These landmark observations open new possibilities for studying exoplanets and their atmospheres.

The measurements were conducted by a team of Astronomers from the University of Leiden, using the William Herschel Telescope (WHT) on La Palma (Canary Islands, Spain) and the United Kingdom Infrared Telescope (UKIRT) on Mauna Kea in Hawai`i. The planet, named TrES-3b, is in a very tight orbit around its host star, TrES-3, transiting the stellar disk once per 31 hours. For comparison, Mercury orbits the sun once every 88 days. TrES-3b is just a little larger than Jupiter, yet orbits around its parent star much closer than Mercury does, making it a "hot jupiter." UKIRT observations caught the transit, from which the size of the planet has been worked out extremely precisely. The WHT observations show the moment the planet moves behind the star, and allow the strength of the planet light to be measured. Astronomers have been trying to observe this effect from the ground for many years, and this is the first success.

Ernst de Mooij, leader of the research team, emphasises, “while a few such observations have been conducted previously from space, they involved measurements at long wavelengths, where the contrast in brightness between the planet and the star is much higher. These are not only the first ground-based observations of this kind, they are also the first to be conducted in the near-infrared, at wavelengths of 2 micron for this planet, where it emits most of its radiation.” Fellow researcher Dr Ignas Snellen adds, “we have been able to measure the temperature of TrES-3b to be a bit over 2000 Kelvin. Since we know how much energy it should receive by the type of its host star, this gives us insights into the thermal structure of the planet's atmosphere, which is consistent with the prediction that this planet should have a so-called 'inversion layer.' It is absolutely amazing that we can now really probe the properties of such a distant world”.

An atmospheric inversion layer is a layer of air where the normal change of temperature with altitude reverses. For example, while we are all familiar with the general decrease of the air temperature as we rise above the ground, often there is a point (usually at a good few thousand feet) where the temperature starts to increase again. This inversion layer prevents air below the inversion layer from escaping to higher altitude. Many places on Earth have strong inversion layers, such as big cities with lots of pollution. Mauna Kea in Hawai`i has a tropical inversion layer about 2,000 feet thick, which usually sits well below the summit. It is this inversion layer that isolates the upper atmosphere from the moist maritime air at lower levels, ensuring that the summit skies are dry and clear, making Mauna Kea such an excellent observing site. It is interesting that the world's great observatories are situated above inversion layers and are now being used to study inversions in planetary atmospheres outside our own solar system.

Current theory says that there are two types of "hot jupiters," one with an inversion layer, and one without. The type is predicted to depend on the amount of light the planet receives from its star. If the inversion layer could be confirmed, for example by measurements at other wavelengths, these observations would fit in perfectly with this theory.

Measuring the emitted light from a planet at different wavelengths reveals the planet's spectrum. This spectrum can be used to determine the planet's day-side temperature. In addition, this spectrum will depend on many physical processes in the planet's atmosphere, such as absorption by molecules like water, carbon monoxide and methane, redistribution of heat around the planet, and temperature structure as a function of height (the aforementioned inversion layer). It will be very useful to be able to compare these for different planets in different environments. "The shorter infrared wavelength targeted in our work is where the planet emits most of its energy and where the molecules have the most influence on the spectrum," says de Mooij.

Alongside the discovery of de Mooij and Snellen, a second team has made a ground-based detection of a different extrasolar planet, OGLE-TR-56b, at the wavelength of 1 micron. Both landmark observations will open up a new window for studying exoplanets and their atmospheres using ground-based telescopes. They show great promise for using future extremely large telescopes which will have much higher sensitivity than the telescopes used today.

Professor Gary Davis, Director of UKIRT, said "this first direct detection of light emitted by another planet, using existing telescopes on the ground, is a major milestone in the study of planets beyond our own Solar System. This is a very exciting scientific discovery, and it nicely demonstrates that existing telescopes like UKIRT and WHT continue to deliver results at the forefront of astronomical research."

Stellar cannibalism is key to formation of overweight stars


Blue Stragglers in Globular Cluster
Credit:NASA Goddard Space Flight Center


January 13, 2009

Researchers have discovered that the mysterious overweight stars known as blue stragglers are the result of 'stellar cannibalism' where plasma is gradually pulled from one star to another to form a massive, unusually hot star that appears younger than it is. The process takes place in binary stars - star systems consisting of two stars orbiting around their common centre of mass. This helps to resolve a long standing mystery in stellar evolution.v

The research, which is part funded by the UK's Science and Technology Facilities Council (STFC) and carried out by scientists at Southampton University and the McMaster University in Canada, is published in the journal Nature on Thursday 15 January.

Blue stragglers are found throughout the Universe in globular clusters - collections of about 100, 000 stars, tightly bound by gravity. According to conventional theories, the massive blue stragglers found in these clusters should have died long ago because all stars in a cluster are born at the same time and should therefore be at a similar phase. These massive rogue stars, however, appear to be much younger than the other stars and are found in virtually every observed cluster.

Dr Christian Knigge from Southampton University, who led the study, comments: "The origin of blue stragglers has been a long-standing mystery. The only thing that was clear is that at least two stars must be involved in the creation of every single blue straggler, because isolated stars this massive simply should not exist in these clusters.

Professor Alison Sills from the McMaster University explains further: "We've known of these stellar anomalies for 55 years now. Over time two main theories have emerged: that blue stragglers were created through collisions with other stars; or that one star in a binary system was 'reborn' by pulling matter off its companion.

The researchers looked at blue stragglers in 56 globular clusters. They found that the total number of blue stragglers in a given cluster did not correlate with predicted collision rate - dispelling the theory that blue stragglers are created through collisions with other stars.

They did, however, discover a connection between the total mass contained in the core of the globular cluster and the number of blue stragglers observed within in. Since more massive cores also contain more binary stars, they were able to infer a relationship between blue stragglers and binaries in globular clusters. They also showed that this conclusion is supported by preliminary observations that directly measured the abundance of binary stars in cluster cores. All of this points to "stellar cannibalism" as the primary mechanism for blue straggler formation.

Dr Knigge says: "This is the strongest and most direct evidence to date that most blue stragglers, even those found in the cluster cores, are the offspring of two binary stars. In our future work we will want to determine whether the binary parents of blue stragglers evolve mostly in isolation, or whether dynamical encounters with other stars in the clusters are required somewhere along the line in order to explain our results."

This discovery comes as the world celebrates the International Year of Astronomy in 2009.

XMM-Newton measures speedy spin of rare celestial object


About this Image: False colour X-ray image of the sky region around SGR 1627-41 obtained with XMM-Newton. The emission indicated in red comes from the debris of an exploded massive star. It covers a region more extended than that previously deduced from radio observations, surrounding the SGR. This suggests that the exploded star was the magnetar’s progenitor.

Credits: ESA/XMM-Newton/EPIC (P. Esposito et al.)

January 13, 2009

XMM-Newton has caught the fading glow of a tiny celestial object, revealing its rotation rate for the first time. The new information confirms this particular object as one of an extremely rare class of stellar zombie – each one the dead heart of a star that refuses to die.

There are just five so-called Soft Gamma-ray Repeaters (SGRs) known, four in the Milky Way and one in our satellite galaxy, the Large Magellanic Cloud. Each is between 10 and 30 km across, yet contains about twice the mass of the Sun. Each one is the collapsed core of a large star that has exploded, collectively called neutron stars.

What sets the Soft Gamma-ray Repeaters apart from other neutron stars is that they possess magnetic fields that are up to 1000 times stronger. This has led astronomers to call them magnetars.

SGR 1627-41 was discovered in 1998 by NASA’s Compton Gamma Ray Observatory when it burst into life emitting around a hundred short flares during a six-week period. It then faded before X-ray telescopes could measure its rotation rate. Thus, SGR 1627-41 was the only magnetar with an unknown period.

Last summer, SGR 1627-41 flared back into life. But it was located in a region of sky that ESA’s XMM-Newton was unable to point at for another four months. This was because XMM-Newton has to keep its solar panels turned towards the Sun for power. So astronomers waited until Earth moved along its orbit, carrying XMM-Newton with it and bringing the object into view. During that time, SGR 1627-41 began fading fast. When it came into view in September 2008, thanks to the superior sensitivity of the EPIC instrument on XMM-Newton, it was still detectable.A team of astronomers took the necessary observations and revealed that it rotates once every 2.6 seconds. “This makes it the second fastest rotating magnetar known,” says Sandro Mereghetti, INAF/Istituto di Astrofisica Spaziale e Fisica Cosmica, Milan, one of the team.A team of astronomers took the necessary observations and revealed that it rotates once every 2.6 seconds. “This makes it the second fastest rotating magnetar known,” says Sandro Mereghetti, INAF/Istituto di Astrofisica Spaziale e Fisica Cosmica, Milan, one of the team.

Theorists are still puzzling over how these objects can have such strong magnetic fields. One idea is that they are born spinning very quickly, at 2-3 milliseconds. Ordinary neutron stars are born spinning at least ten times more slowly. The rapid rotation of a new-born magnetar, combined with convection patterns in its interior, gives it a highly efficient dynamo, which builds up such an enormous field.

With a rotation rate of 2.6 seconds, this magnetar must be old enough to have slowed down. Another clue to the magnetar’s age is that it is still surrounded by a supernova remnant. During the measurement of its rotation rate, XMM-Newton also detected X-rays coming from the debris of an exploded star, possibly the same one that created the magnetar. “These usually fade to invisibility after a few tens of thousand years. The fact that we still see this one means it is probably only a few thousand years old”, says Mereghetti.

If it flares again, the team plan to re-measure its rotation rate. Any difference will tell them how quickly the object is decelerating. There is also the chance that SGR 1627-41 will release a giant flare. Only three such events have been seen in the last 30 years, each from a different SGR, but not from SGR 1627-41.

These superflares can supply as much energy to Earth as solar flares, even though they are halfway across the Galaxy, whereas the Sun is at our celestial doorstep. “These are intriguing objects; we have much still to learn about them,” says Mereghetti.

Saturday, January 10, 2009

Could Quark Stars Explain Magnetars Strong Magnetic Field?


The magnetic field surrounding the mysterious magnetar
Credit:NASA


Magnetars are the violent, exotic cousins of the well known neutron star. They emit excessive amounts of gamma-rays, X-rays and possess a powerful magnetic field. Neutron stars also have very strong magnetic fields (although weak when compared with magnetars), conserving the magnetic field of the parent star before it exploded as a supernova. However, the huge magnetic field strength predicted from observations of magnetars is a mystery. Where do magnetars get their strong magnetic fields? According to new research, the answer could lie in the even more mysterious quark star…

It is well known that neutron stars have very strong magnetic fields. Neutron stars, born from supernovae, preserve the angular momentum and magnetism of the parent star. Therefore, neutron stars are extremely magnetic, often rapidly spinning bodies, ejecting powerful streams of radiation from their poles (seen from Earth as a pulsar should the collimated radiation sweep through our field of view). Sometimes, neutron stars don't behave as they should, ejecting copious amounts of X-rays and gamma-rays, exhibiting a very powerful magnetic field. These strange, violent entities are known as magnetars. As they are a fairly recent discovery, scientists are working hard to understand what magnetars are and how they acquired their strong magnetic field.

Denis Leahy, from the University of Calgary, Canada, presented a study on magnetars at a January 6th session at this week's AAS meeting in Long Beach, revealing the hypothetical "quark star" could explain what we are seeing. Quark stars are thought to be the next stage up from neutron stars; as gravitational forces overwhelm the structure of the neutron degenerate matter, quark matter (or strange matter) is the result. However, the formation of a quark star may have an important side effect. Colour ferromagnetism in color-flavour locking quark matter (the most dense form of quark matter) could be a viable mechanism for generating immensely powerful magnetic flux as observed in magnetars. Therefore, magnetars may be the consequence of very compressed quark matter.


These results were arrived at by computer simulation, how can we observe the effect of a quark star — or the "quark star phase" of a magnetar — in a supernova remnant? According to Leahy, the transition from neutron star to quark star could occur from days to thousands of years after the supernova event, depending on the conditions of the neutron star. And what would we see when this transition occurs? There should be a secondary flash of radiation from the neutron star after the supernova due to liberation of energy as the neutron structure collapses, possibly providing astronomers with an opportunity to "see" a magnetar being "switched on". Leahy also calculates that 1-in-10 supernovae should produce a magnetar remnant, so we have a pretty good chance at spotting the mechanism in action.