Wednesday, December 29, 2010
A new glistering zirconium star found
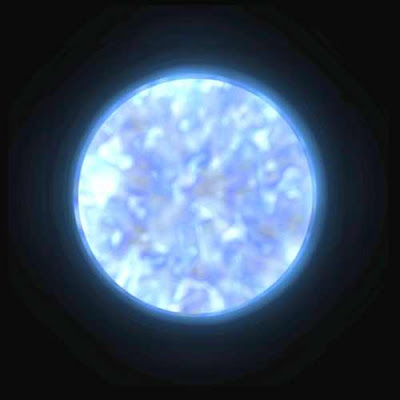
Artist’s impression of LS IV – 14 116. The white clouds are rich in zirconium and lie above the blue surface of the star. Image: Natalie Behara
By Royal Astronomical Society, United Kingdom.
Published: December 8, 2010.
A team of astronomers led by graduate student Naslim and supervisor Simon Jeffery from Armagh Observatory in Northern Ireland has found what at first sight appears to be the most zirconium-rich star ever discovered. Zirconium, the material used by jewelers to make false diamonds, glitters in clouds above the star's surface.
The team made the discovery while looking for chemical clues that explain why a small group of stars reaching the end of their lives, known as helium-rich hot sub-dwarfs, have less hydrogen on their surfaces than other similar stars. Using data obtained with the Anglo-Australian Telescope at the Siding Spring Observatory in New South Wales, the team looked at the evolved star LS IV-14 116, which is 2,000 light-years from the Sun in the direction of the border between the constellations Capricornus and Aquarius.
The scientists used the telescope instruments to disperse the light of the star into a spectrum. Different elements and molecules give rise to characteristic patterns in stellar spectra, allowing Earth-based scientists to determine their composition.
As expected, the spectrum of LS IV-14 116 had the usual lines arising from more common elements, but other strong lines were less easy to identify. A careful study showed four of these lines were due to a form of zirconium that only exists at temperatures above 36,000° Fahrenheit (20,000° Celsius) and that had never previously been found in an astronomical spectrum.
Alan Hibbert, from Queen's University Belfast, computed a model of the zirconium atom to predict the expected line strengths. With this information, the team measured the zirconium abundance in LS IV-14 116 to be 10,000 times as high as in the Sun — meaning that 1 atom in every 200,000 is zirconium rather than 1 in 2 billion. Further work showed the remaining unidentified lines to come from strontium, germanium, and yttrium. These elements are found to be between 1,000 and 10,000 times more abundant than normal.
The Armagh team argued that the unusual abundances in LS IV-14 116 are caused by the formation of cloud layers in the star's atmosphere — the only part of a star that can be seen directly. High concentrations of certain elements, mainly metals heavier than calcium, build up in these clouds, but the same elements are scarce in layers above and below, meaning that their overall abundance is near normal. Natalie Behara, now at the University Libre de Bruxelles, calculated models of the star's atmosphere. This may well have a dramatic appearance, with many thin cloud layers, each due to a different metal.
The team also suggests that the star is shrinking from being a bright cool giant to a faint hot sub-dwarf. As the star shrinks, different elements sink down or float up in the atmosphere to a region where they become highly visible, making the apparent composition sensitive to the star's recent history.
Most stars like the Sun have about 10 zirconium atoms for every million silicon atoms. LS IV-14 116 has 2 million zirconium atoms for every 1 million silicon atoms. It is estimated that the zirconium layer seen in LS IV-14 116 would weigh about 4 billion tons, or 4,000 times the world's annual production of zirconium.
"It was very exciting to discover these completely new chemical signatures in our data,” said Jeffery. “The peculiar abundances measured in this star, and hopefully in others, offer a new tool to explore a stage of stellar evolution that is extremely difficult to observe directly."
"The huge excess of zirconium was a complete surprise,” said Naslim. “We had no reason to think this star was more peculiar than any other faint blue star discovered so far."
Wednesday, November 17, 2010
Chandra finds most immature nearby black hole
This composite image shows a supernova within the galaxy M100 that may contain the youngest known black hole in our cosmic neighborhood. In this image, Chandra's X-rays are colored gold, while optical data from ESO's Very Large Telescope are shown in yellow-white and blue, and infrared data from Spitzer are red. The location of the supernova, known as SN 1979C, is in the circle.
By NASA Headquarters, Washington, D.C.
Published: November 15, 2010
This black hole could help scientists better understand how massive stars explode, which ones leave behind black holes or neutron stars, and the number of black holes in our galaxy and others.Astronomers using NASA's Chandra X-ray Observatory have found evidence of the youngest black hole known to exist in our cosmic neighborhood. The 30-year-old black hole provides a unique opportunity to watch this type of object develop from infancy.The 30-year-old object is a remnant of SN 1979C, a supernova in the galaxy M100, which is approximately 50 million light-years from Earth. Data from Chandra, NASA's Swift satellite, the European Space Agency's XMM-Newton, and the German ROSAT observatory revealed a bright source of X-rays that has remained steady during observation from 1995 to 2007. This suggests the object is a black hole being fed either by material falling into it from the supernova or a binary companion.
"If our interpretation is correct, this is the nearest example where the birth of a black hole has been observed," said Daniel Patnaude from the Harvard-Smithsonian Center for Astrophysics in Cambridge, Massachusetts.
The scientists think SN 1979C, first discovered by an amateur astronomer in 1979, formed when a star about 20 times more massive than the Sun collapsed. Many new black holes in the distant universe previously have been detected in the form of gamma-ray bursts (GRBs).
However, SN 1979C is different because it is much closer and belongs to a class of supernovae unlikely to be associated with a GRB. Theory predicts most black holes in the universe should form when the core of a star collapses and a GRB is not produced.
"This may be the first time the common way of making a black hole has been observed," said Abraham Loeb, also of the Harvard-Smithsonian Center for Astrophysics. "However, it is very difficult to detect this type of black hole birth because decades of X-ray observations are needed to make the case."
X-ray Image of SN 1979C
Photo by NASA/CXC/SAO/D.
The idea of a black hole with an observed age of only about 30 years is consistent with recent theoretical work. In 2005, scientists presented a theory that a jet from a black hole that was unable to penetrate the hydrogen envelope of the star to form a GRB powered the bright optical light of this supernova. The results seen in the observations of SN 1979C fit this theory very well.
Although the evidence points to a newly formed black hole in SN 1979C, another intriguing possibility is that a young, rapidly spinning neutron star with a powerful wind of high-energy particles could be responsible for the X-ray emission. This would make the object in SN 1979C the youngest and brightest example of such a "pulsar wind nebula" and the youngest known neutron star. The Crab pulsar, the best-known example of a bright pulsar wind nebula, is about 950 years old.
"It's very rewarding to see how the commitment of some of the most advanced telescopes in space, like Chandra, can help complete the story," said Jon Morse from NASA's Science Mission Directorate.
Sunday, November 14, 2010
Detailed dark matter map yields clues to galaxy cluster growth
This NASA Hubble Space Telescope image shows the distribution of dark matter in the center of the giant galaxy cluster Abell 1689, containing about 1,000 galaxies and trillions of stars.
By STScl, Baltimore, Maryland
Published: November 12, 2010
Astronomers using NASA's Hubble Space Telescope took advantage of a giant cosmic magnifying glass to create one of the sharpest and most detailed maps of dark matter in the universe. Dark matter is an invisible and unknown substance that makes up the bulk of the universe's mass.
The new dark matter observations may yield new insights into the role of dark energy in the universe's early formative years. The result suggests that galaxy clusters may have formed earlier than expected, before the push of dark energy inhibited their growth. A mysterious property of space, dark energy fights against the gravitational pull of dark matter. Dark energy pushes galaxies apart from one another by stretching the space between them, thereby suppressing the formation of giant structures called galaxy clusters. One way astronomers can probe this primeval tug-of-war is through mapping the distribution of dark matter in clusters.
A team led by Dan Coe from NASA's Jet Propulsion Laboratory in Pasadena, California, used Hubble's Advanced Camera for Surveys to chart the invisible matter in the massive galaxy cluster Abell 1689, located 2.2 billion light-years away. The cluster's gravity, the majority of which comes from dark matter, acts like a cosmic magnifying glass, bending and amplifying the light from distant galaxies behind it. This effect, called gravitational lensing, produces multiple, warped, and greatly magnified images of those galaxies, like the view in a funhouse mirror. By studying the distorted images, astronomers estimated the amount of dark matter within the cluster. If the cluster's gravity only came from the visible galaxies, the lensing distortions would be much weaker.
Based on their higher-resolution mass map, Coe and his collaborators confirmed previous results showing that the core of Abell 1689 is much denser in dark matter than expected for a cluster of its size, based on computer simulations of structure growth. Abell 1689 joins a handful of other well-studied clusters found to have similarly dense cores. The finding is surprising because the push of dark energy early in the universe's history would have stunted the growth of all galaxy clusters.
"Galaxy clusters, therefore, would had to have started forming billions of years earlier in order to build up to the numbers we see today," Coe said. "At earlier times, the universe was smaller and more densely packed with dark matter. Abell 1689 appears to have been well fed at birth by the dense matter surrounding it in the early universe. The cluster has carried this bulk with it through its adult life to appear as we observe it today."
Mapping the Invisible
Abell 1689 is among the most powerful gravitational lensing clusters ever observed. Coe's observations, combined with previous studies, yielded 135 multiple images of 42 background galaxies.
"The lensed images are like a big puzzle," Coe says. "Here we have figured out, for the first time, a way to arrange the mass of Abell 1689 such that it lenses all of these background galaxies to their observed positions." Coe used this information to produce a higher-resolution map of the cluster's dark matter distribution than was possible before.
Coe teamed with mathematician Edward Fuselier, who, at the time, was at the United States Military Academy at West Point, to devise a new technique to calculate the new map. "Thanks, in large part, to Eddie's contributions, we have finally 'cracked the code' of gravitational lensing,” said Coe. “Other methods are based on making a series of guesses as to what the mass map is, and then astronomers find the one that best fits the data. Using our method, we can obtain directly from the data a mass map that gives a perfect fit."
Astronomers are planning to study more clusters to confirm the possible influence of dark energy. A major Hubble program that will analyze dark matter in gigantic galaxy clusters is the Cluster Lensing and Supernova survey with Hubble (CLASH). In this survey, the telescope will study 25 clusters for a total of one month over the next 3 years. The CLASH clusters were selected because of their strong X-ray emission, indicating they contain large quantities of hot gas. This abundance means the clusters are extremely massive. By observing these clusters, astronomers will map the dark matter distributions and look for more conclusive evidence of early cluster formation, and possibly early dark energy.
When Galaxies Collide!
NGC 2623: Galaxy Merger from Hubble
Credit: NASA, ESA and A. Evans (Stony Brook).
Where do stars form when galaxies collide? To help find out, astronomers imaged the nearby galaxy merger NGC 2623 in high resolution with the Hubble Space Telescope in 2007. Analysis of this Hubble image and images of NGC 2623 in infrared light by the Spitzer Space Telescope, in X-ray light by XMM-Newton, and in ultraviolet light by GALEX, indicate that two originally spiral galaxies appear now to be greatly convolved and that their cores have unified into one active galactic nucleus (AGN). Star formation continues around this core near the above image center, along the stretched out tidal tails visible on either side, and perhaps surprisingly, in an off-nuclear region on the upper left where clusters of bright blue stars appear. Galaxy collisions can take hundreds of millions of years and take several gravitationally destructive passes. NGC 2623, also known as Arp 243, spans about 50,000 light years and lies about 250 million light years away toward the constellation of the Crab (Cancer). Reconstructing the original galaxies and how galaxy mergers happen is often challenging, sometimes impossible, but generally important to understanding how our universe evolved.
Date:14th November,2010
Galaxy mergers can occur when two (or more) galaxies collide. They are the most violent type of galaxy interaction. Although galaxy mergers do not involve stars or star systems actually colliding, due to the vast distances between stars in most circumstances, the gravitational interactions between galaxies and the friction between the gas and dust have major effects on the galaxies involved. The exact effects of such mergers depend on a wide variety of parameters such as collision angles, speeds, and relative size/composition, and are currently an extremely active area of research. There are some generally accepted results, however:
1. When one of the galaxies is significantly larger than the other, the larger will often "eat" the smaller, absorbing most of its gas and stars with little other major effect on the larger galaxy. Our home galaxy, the Milky Way, is thought to be currently absorbing smaller galaxies in this fashion, such as the Canis Major Dwarf Galaxy, and possibly the Magellanic Clouds. The Virgo Stellar Stream is thought to be the remains of a dwarf galaxy that has been mostly merged with the Milky Way.
2. If two spiral galaxies that are approximately the same size collide at appropriate angles and speeds, they will likely merge in a fashion that drives away much of the dust and gas through a variety of feedback mechanisms that often include a stage in which there are active galactic nuclei. This is thought to be the driving force behind many quasars. The end result is an elliptical galaxy, and many astronomers hypothesize that this is the primary mechanism that creates ellipticals.
Note that the Milky Way and the Andromeda Galaxy will probably collide in about 4.5 billion years. If these galaxies merged, the result would quite possibly be an elliptical galaxy as described above.
One of the largest galaxy mergers ever observed consisted of four elliptical galaxies in the cluster CL0958+4702. It may form one of the largest galaxies in the Universe.
Galaxy mergers can be simulated in computers, to learn more about galaxy formation. Galaxy pairs initially of any morphological type can be followed, taking into account all gravitational forces, and also the hydrodynamics and dissipation of the interstellar gas, the star formation out of the gas, and the energy and mass released back in the interstellar medium by supernovae.
Determining 500th Exoplanet Will Be a Tricky Job
2MASS J044144 is a brown dwarf with a companion about 5-10 times the mass of Jupiter. It is not clear whether this companion object is a sub-brown dwarf or a planet.
Provided By: Space.com
Date: 14th November,2010
The number of planets that astronomers have discovered orbiting distant stars hovers right below 500. But confirming which remote flicker of light is the milestone alien world will be a tricky affair.At NASA's last count, astronomers had confirmed the discovery of 496 planets around alien suns. There are signs of dozens more, if not hundreds, but it will take time to weed out which of the detections are actual worlds and which are merely false alarms.Some astronomers now expect that official discovery of the 500th alien planet by January 2011.In the meantime, scientists lean on telescopes and space observatories, as well as a tried-and-true bag of tricks, for identifying and confirming planets beyond our own solar system.There are four primary techniques currently used to find exoplanets, each with its own pitfalls.The radial velocity method looks for repeated wobbles in a star's movements that are signs of a planet's gravitational pull yanking it back and forth.
However, if a planet has very little mass, it hardly exerts much of a pull — if an astronomer is trying to detect something like an Earth-size planet, the noise or static in the data can be mistaken for a planet. Overcoming this problem largely requires measuring the star over and over and over again, said astrobiologist Alan Boss at Carnegie Institution of Washington."That can take a lot of telescope time, which can be very, very expensive," said planetary scientist Sara Seager at the Massachusetts Institute of Technology. "One night of time at the Keck telescope can cost $50,000."The transit method looks for dips in a star's brightness whenever a planet crosses in front of it. The problem is that if the star under observation is in mutual orbit with another star, it's that other star that could lead to regular dips and surges in brightness.
Another technique, called the microlensing method, looks for distortions in light resulting from the pull of gravity. The gravitational field of a planet can have a measurable effect on light that passes by it.However, this occurs only when a star with a planet happens to line up with another star — a brief event that never happens again, "like two ships passing in the night," explained astronomer Geoffrey Marcy at the University of California at Berkeley.The difficulty in reproducing results can make microlensing hard to rely on, although there have been solid examples of microlensing that overcame any doubts.Astronomers also may directly image the light from an exoplanet. "The down side there is, how do you know if that candidate is a planet or a faint star?" Marcy said. "Faint stars look a lot like glowing planets."
What makes a planet?
There is no exoplanet list formally sanctioned by the International Astronomical Union, the body that assigns official designations to celestial bodies.Instead, there are only unofficial lists maintained by researchers in the field, such as astrobiologist Jean Schneider at the Paris-Meudon Observatory and astronomer Jason Wright of the University of California in Berkeley.There are also no hard and fast rules as to whether a candidate should be declared an exoplanet; each researcher and group has its own preferences, Schneider said. To get others to accept their results, scientists often wait until the probability that their results are false alarms falls below 1 percent or so.The standard way that the field confirms the report of a planet is through its acceptance by knowledgeable referees into a scientific journal. Still, as many as 50 to 100 exoplanets were revealed in talks, only to wait years before their appearance in a journal. The discoverers may simply have been too busy doing actual work to write up the papers, Schneider explained.
False alarms:
In addition, even after publication, a few exoplanets have been retracted as false alarms — "five to 10 since 1989," Schneider estimated."My research group publishes data on an exoplanet when the false alarm probability drops below 1 percent, which means about 1 percent will be wrong," Marcy said. "There's always a chance to be wrong, and as scientists we try to calculate what that probability is and present it openly." "There's always a chance there's a few errors in data to make something look like a planet," he added. "This can happen to anyone — just one of those things that happens when you're pushing a frontier, pushing instruments to their bitter limits. This kind of astronomy is hard work, and there are lots of ways to make a mistake. A number might slip through, but they're generally corrected in a year or two."
Another possible point of confusion is the fuzzy boundary that separates a planet from a "brown dwarf" — a large gaseous body, more than 13 times the mass of Jupiter, that failed to become a star. "Something 20 Jupiter masses and below is likely a planet, but there's ambiguity there," Schneider said.All these concerns might give the impression of a list of published exoplanet being a bit of a mess, but overall, Schneider contended, only 1 or 2 percent of these discoveries are unclear so far."The real acid test in the field is getting two methods to detect an object — for instance, a radial velocity signature plus a transit detection," Boss said. "There are about 100 of such absolutely, positively identified planets so far."
Exoplanet overdrive
In the end, "there is no real honor roll of planets, no real way to say which the 500th planet will be," Boss said.Still, while it has taken scientists roughly 15 years to confirm the detection of the nearly 500 planets known so far, the pace promises to grow rapidly.NASA's Kepler mission, a space observatory surveying a large sample of stars as it orbits the sun, revealed in June that it had detected more than 750 possible exoplanets using the transit method within its first 43 days of operation."Kepler is beating us all by a million miles," Marcy said.Many of the candidates Kepler discovered are now getting verified with radial velocity confirmations. "On Feb. 1, we'll announce all of them — a huge avalanche of exoplanet candidates," Marcy said."The days of having to have perfect exoplanets are going away," Seager noted. "We're going to publish so many planets that we're not going to be able to validate all of them. Instead, we'll have so many we can start studying them statistically in groups."Even without Kepler, there are roughly 100 exoplanet candidates that researchers are working hard to confirm, Marcy said."We could well hit 500 on Jean Schneider's list by January," Boss said.
Intracluster medium
Comparison of the Chandra image of the X-ray emission from the intracluster medium in the core of the Abell 2199 galaxy cluster against the optical emission of the galaxies (from the DSS)
Date: 14th November 2010
In astronomy, the intracluster medium (or ICM) is the superheated plasma present at the center of a galaxy cluster. This is gas heated to temperatures of between roughly 10 and 100 megakelvins and consisting mainly of ionised hydrogen and helium, containing most of the baryonic material in the cluster. The ICM strongly emits X-ray radiation.The ICM is heated to high temperatures by the gravitational energy released by the formation of the cluster from smaller structures. Kinetic energy gained from the gravitational field is converted to thermal energy by shocks. The high temperature ensures that the elements present in the ICM are ionised. Light elements in the ICM have all the electrons removed from their nuclei.
The ICM is composed primarily of ordinary baryons (mainly ionised hydrogen and helium). This plasma is enriched with heavy elements, such as iron. The amount of heavy elements relative to hydrogen (known as metallicity in astronomy) is roughly a third of the value in the sun. Most of the baryons in the cluster (80-95%) reside in the ICM, rather than in the luminous matter, such as galaxies and stars. However, most of the mass in a galaxy cluster consists of dark matter.
Although the ICM on the whole contains the bulk of a cluster's baryons, it is not very dense, with typical values of 10^-3 particles per cubic centimeter. The mean free path of the particles is roughly 10^16 m, or about one lightyear.
The strong gravitational field of clusters means that they can retain even elements created in high-energy supernovae. Studying the composition of the ICM at varying redshift (which results in looking at different points back in time) can therefore give a record of element production in the universe if they are typical.
As the ICM is so hot, it mostly emits X-ray radiation by the bremsstrahlung process and X-ray emission lines from the heavy elements. These X-rays can be observed using an X-ray telescope. Depending on the telescope, maps of the ICM can be made (the X-ray emission is proportional to the density of the ICM squared), and X-ray spectra can be obtained. The brightness of the X-rays tells us about the density of the gas. The spectra allow temperature and metallicity of the ICM to be measured.
The density of the ICM rises towards the centre of the cluster with a strong peak. In addition, the temperature of the ICM typically drops to 1/2 or 1/3 of the outer value in the central regions. The metallicity rises from the outer region towards the centre. In some clusters (e.g. the Centaurus cluster) the metallicity of the gas can rise above that of the sun.As the ICM in the core of many galaxy clusters is dense, it emits a lot of X-ray radiation (the emission is proportional to the density-squared). In the absence of heating, the ICM should be cooling. As it cools, hotter gas will flow in to replace it. This is known as a cooling flow. The cooling flow problem is the lack of evidence of cooling of the ICM.
Mark III (new space suit from NASA)
Provided By: NASA
Date:sunday,November 14th, 2010
The Mark III or MK III (H-1) is a NASA space suit technology demonstrator built by ILC Dover. While heavier than other suits (at 59 kilograms (130 lb), with a 15 kilograms (33 lb) Primary Life Support System backpack), the Mark III is more mobile, and is designed for a relatively high operating pressure.
The Mark III is a rear-entry suit, unlike the EMU currently in use, which is a waist-entry suit. The suit incorporates a mix of hard and soft suit components, including hard upper torso, hard lower torso and hip elements made of graphite/epoxy composite, bearings at the shoulder, upper arm, hip, waist, and ankle, and soft fabric joints at the elbow, knee, and ankle.
The 8.3 pounds per square inch (57 kPa) operating pressure of the Mark III makes it a "zero-prebreathe" suit, meaning that astronauts would be able to transition directly from a one atmosphere, mixed-gas space station environment, such as that on the International Space Station, to the suit, without risk of the bends, which can occur with rapid depressurization from an atmosphere containing nitrogen or another inert gas. Currently, astronauts must spend several hours in a reduced pressure, pure oxygen environment before EVA to avoid these risks.
The Mark III, as well as ILC's I-Suit, has been involved in field testing during NASA's annual Desert Research and Technology Studies (D-RATS) field trials, during which suit occupants interact with one another, and with rovers and other equipment.
Subjects wearing the Mark III were able to kneel to pick up objects, a task which would be difficult in either the Apollo A7L or Shuttle EMU suit. Dean Eppler, a geologist at NASA's Johnson Space Center who wore the suit during testing, commented that "the Mark III in many cases has almost shirtsleeve-equivalent mobility." Eppler has spent more than 100 hours in the Mark III.
Despite the success of zero- and partial-gravity testing on the KC-135 Vomit Comet, the EVA Project Office at Johnson Space Center is currently looking toward a soft suit design for future astronauts.
Thursday, November 11, 2010
Giant structure in our galaxy
By NASA Headquarters, Washington, D.C.
Published: November 10, 2010
NASA's Fermi Gamma-ray Space Telescope has unveiled a previously unseen structure centered in the Milky Way. The feature spans 50,000 light-years, and it may be the remnant of an eruption from a super-sized black hole at the center of our galaxy.
"What we see are two gamma-ray-emitting bubbles that extend 25,000 light-years north and south of the galactic center," said Doug Finkbeiner from the Harvard-Smithsonian Center for Astrophysics in Cambridge, Massachusetts, who first recognized the feature. "We don't fully understand their nature or origin."
The structure spans more than half of the visible sky, from the constellation Virgo to the constellation Grus, and it may be millions of years old.
Finkbeiner, along with Meng Su and Tracy Slatyer, both from Harvard, discovered the bubbles by processing publicly available data from Fermi's Large Area Telescope (LAT). The LAT is the most sensitive and highest-resolution gamma-ray detector ever launched. Gamma rays are the highest energy form of light.
Other astronomers studying gamma rays hadn't detected the bubbles partly because of a fog of gamma rays that appears throughout the sky. The fog happens when particles moving near the speed of light interact with light and interstellar gas in the Milky Way. The LAT team constantly refines models to uncover new gamma-ray sources obscured by this diffuse emission. By using various estimates of the fog, Finkbeiner and his colleagues were able to isolate it from the LAT data and unveil the giant bubbles.
Scientists now are conducting more analyses to better understand how the never-before-seen structure was formed. The bubble emissions are much more energetic than the gamma-ray fog seen elsewhere in the Milky Way. The bubbles also appear to have well-defined edges. The structure's shape and emissions suggest it was formed as a result of a large and relatively rapid energy release — the source of which remains a mystery.
One possibility includes a particle jet from the supermassive black hole at the galactic center. In many other galaxies, astronomers see fast particle jets powered by matter falling toward a central black hole. While there is no evidence the Milky Way's black hole has such a jet today, it may have had one in the past. The bubbles also may have formed as a result of gas outflows from a burst of star formation, perhaps the one that produced many massive star clusters in the Milky Way's center several million years ago.
"In other galaxies, we see that starbursts can drive enormous gas outflows," said David Spergel from Princeton University in New Jersey. "Whatever the energy source behind these huge bubbles may be, it is connected to many deep questions in astrophysics."
Hints of the bubbles appear in earlier spacecraft data. X-ray observations from the German-led Roentgen Satellite suggested subtle evidence for bubble edges close to the galactic center or in the same orientation as the Milky Way. NASA's Wilkinson Microwave Anisotropy Probe detected an excess of radio signals at the position of the gamma-ray bubbles.
The Fermi LAT team also revealed the instrument's best picture of the gamma-ray sky, the result of 2 years of data collection.
"Fermi scans the entire sky every 3 hours, and as the mission continues and our exposure deepens, we see the extreme universe in progressively greater detail," said Julie McEnery from NASA's Goddard Space Flight Center in Greenbelt, Maryland. NASA's Fermi is an astrophysics and particle physics partnership, developed in collaboration with the U.S. Department of Energy, with important contributions from academic institutions and partners in France, Germany, Italy, Japan, Sweden, and the United States.
"Since its launch in June 2008, Fermi repeatedly has proven itself to be a frontier facility, giving us new insights ranging from the nature of space-time to the first observations of a gamma-ray nova," said Jon Morse from NASA Headquarters, Washington, D.C. "These latest discoveries continue to demonstrate Fermi's outstanding performance."
NASA's Next Big Space Telescope to Cost an Extra $1.5 Billion
During cryogenic testing, the mirrors will be subjected to temperatures dipping to -415 degrees Fahrenheit, permitting engineers to measure in extreme detail how the shape of each mirror changes as it cools. Credit: NASA/MSFC/David Higginbotham/Emmett Given
source:space.com
11th November,2010.
WASHINGTON — NASA's James Webb Space Telescope (JWST) is expected to cost at least $1.5 billion more than current estimates and its launch will be delayed a minimum of 15 months, according to an independent review panel tapped to investigate escalating costs and management issues with the next-generation flagship astronomy mission.
U.S. Sen. Barbara Mikulski (D-Md.) called for the independent review in June to identify the root causes of cost growth and schedule delays on the JWST.
"The Webb telescope will now cost $6.5 billion, $1.5 billion more than the estimate included in NASA's February 2010 budget request, Mikulski wrote in a Nov. 10 letter to NASA Administrator Charles Bolden after reading the Oct. 29 report. "Its launch will be delayed by over a year, from June 2014 to September 2015."
Led by NASA's Goddard Space Flight Center in Greenbelt, Md., the James Webb Space Telescope is an infrared telescope with a 6.5-meter foldable mirror and a deployable sunshield the size of a tennis court. Northrop Grumman Aerospace Systems of Redondo Beach, Calif., is prime contractor. An Ariane 5 rocket provided by the European Space Agency is slated to launch the observatory to the second Lagrange point — a gravitationally stable spot 1.5 million kilometers from Earth.
In her letter, Mikulski said NASA must have a sense of urgency and frugality in correcting the JWST's management problems and present Congress with a realistic budget for the program.
"We cannot afford to continue with business as usual in this stark fiscal situation," she wrote.
The panel, led by John Casani, special assistant to the director of NASA's Jet Propulsion Laboratory in Pasadena, Calif., attributed the cost growth and schedule delays to "budgeting and program management, not technical performance," according to the report, which characterized the JWST's technical progress as "commendable and often excellent."
However, the report notes that "there may be a number of low probability threats whose occurrence could cause an additional year delay in launch and a correspondingly higher cost."
The panel recommends restructuring the JWST project office at Goddard to emphasize cost and schedule ceilings. "The flawed practice by the Project of not adequately accounting for threats in the budgeting process needs immediate correction," the report states.
However, the report also found that "the JWST Project has invested funds wisely in advancing the necessary technologies and reducing technical risk such that the funds invested to date have not been wasted," according to the executive summary. "The management approach, however, needs to change to focus on overall life cycle cost and a well-defined launch date."
Bolden, in a Nov. 10 statement, said he agrees with the panel's findings and that NASA would overhaul the program's management structure.
"No one is more concerned about the situation we find ourselves in than I am, and that is why I am reorganizing the JWST Project at Headquarters and the Goddard Space Flight Center, and assigning a new senior manager at Headquarters to lead this important effort," Bolden said in the statement.
The NASA chief said he is encouraged by the panel's finding that the JWST is technically sound and that the project continues to meet its milestones.
"However, I am disappointed we have not maintained the level of cost control we strive to achieve — something the American taxpayer deserves in all of our projects," he said. "NASA is committed to finding a sustainable path forward for the program based on realistic cost and schedule assessments."
Saturday, October 30, 2010
Giant star goes supernova and is completely covered by its own dust
Ohio State University, Columbus
While searching the skies for black holes using the Spitzer Space Telescope Deep Wide Field Survey, Ohio State University astronomers discovered a giant supernova that was smothered in its own dust. In this artist’s rendering, an outer shell of gas and dust — which erupted from the star hundreds of years ago — obscures the supernova within. This event in a distant galaxy hints at one possible future for the brightest star system in our own Milky Way.
Published: October 14, 2010
A giant star in a faraway galaxy recently ended its life with a dust-shrouded whimper instead of the more typical bang.
Ohio State University researchers suspect that this odd event — the first one of its kind viewed by astronomers — was more common early in the universe. It also hints at what we would see if the brightest star system in our galaxy became a supernova.
Christopher Kochanek from Ohio State University and his colleagues describe how the supernova appeared in late August 2007 as part of the Spitzer Space Telescope Deep Wide Field Survey.
The astronomers were searching the survey data for active galactic nuclei (AGN) — supermassive black holes at the centers of galaxies. AGN radiate enormous amounts of heat as material is sucked into the black hole. In particular, the astronomers were searching for hot spots that varied in temperature because these could provide evidence of changes in how the material was falling into the black hole.
Normally, astronomers wouldn't expect to find a supernova this way, said Szymon Kozlowski from Ohio State. Supernovae release most of their energy as light, not heat.
But one hot spot, which appeared in a galaxy some 3 billion light-years from Earth, didn't match the typical heat signal of an AGN. The visible spectrum of light emanating from the galaxy didn't show the presence of an AGN either.
Enormous heat flared from the object for a little over 6 months, then faded away in early March 2008 — another clue that the object was a supernova. "Over 6 months, it released more energy than our Sun could produce in its entire lifetime," Kozlowski said.
The astronomers knew that if the source were a supernova, the extreme amount of energy it emitted would qualify it as a big one, or a "hypernova." The temperature of the object was around 1,300° Fahrenheit (700° Celsius) — only a little hotter than the surface of the planet Venus. They wondered what could absorb that much light energy and dissipate it as heat?
The answer: Dust, and a lot of it.
Using what they learned from the Spitzer survey, the astronomers worked backward to determine what kind of star could have spawned the supernova, and how the dust was able to partly muffle the explosion. They calculated that the star was probably a giant, at least 50 times more massive than our Sun. Such massive stars typically belch clouds of dust as they near the end of their existence.
This particular star must have had at least two such ejections, they determined — one about 300 years before the supernova, and one only about 4 years before it. The dust and gas from both ejections remained around the star, each in a slowly expanding shell. The inner shell from 4 years ago would be close to the star, while the outer shell from 300 years ago would be farther away.
"We think the outer shell must be nearly opaque, so it absorbed any light energy that made it through the inner shell and converted it to heat," said Kochanek. That's why the supernova showed up on the Spitzer survey as a hot dust cloud.
Krzysztof Stanek from Ohio State said that stars probably choked on their own dust more often in the distant past.
"These events are much more likely to happen in a small, low-metallicity galaxy," Stanek said — meaning a young galaxy that hadn't been around long enough for its stars to fuse hydrogen and helium into the more complex chemicals that astronomers refer to as metals.
Still, Kozlowski added, NASA's Wide-field Infrared Explorer (WISE) will likely find more such supernovae. "I would expect WISE to see 100 of these events in 2 years, now that we know what to look for," he said.
Because of the alignment of the galaxy with Earth and our Sun, astronomers were not able to see what the event looked like to the naked eye while it was happening. But Kochanek believes that we might see the star brighten a decade or so from now. That's how long it will take for the shock wave from the exploding star to reach the inner dust shell and slam it into the outer shell. Then we'll have something to see here on Earth.
We do have at least one chance to see a similar light show closer to home, though. "If Eta Carinae went supernova right now, this is what it would probably look like," Kochanek said, referring to the brightest star system in our Milky Way Galaxy.
The two stars that make up Eta Carinae are 7,500 light-years away, and they host a distinctive dust shell dubbed the Homunculus Nebula. Astronomers believe that the nebula was created when the larger of the two stars underwent a massive eruption around 1840, and that future eruptions are likely.
10,000 years into the future
The multicolor snapshot at top captures the central region of the giant globular cluster Omega Centauri. All the stars in the image are moving in random directions, like a swarm of bees. From these measurements, they can predict the stars' future movement. The bottom illustration charts the future positions of the stars highlighted by the white box in the top image. Each streak represents the motion of the star over the next 600 years. The motion between dots corresponds to 30 years.
Photo by NASA/ESA/STScI
Looking at the heart of Omega Centauri, a globular cluster in the Milky Way, scientists have calculated how the stars will move over the next 10,000 years.
Published: October 26, 2010 (By STScI/ESA)
Astronomers are used to looking millions of years into the past. Now scientists have used the NASA/ESA Hubble Space Telescope to look thousands of years into the future. Looking at the heart of Omega Centauri, a globular cluster in the Milky Way, they have calculated how the stars will move over the next 10,000 years.
The globular star cluster Omega Centauri has caught the attention of sky watchers ever since the ancient astronomer Ptolemy first cataloged it 2,000 years ago. Ptolemy, however, thought Omega Centauri was a single star. He didn't know that the "star" was actually a beehive swarm of nearly 10 million stars, all orbiting a common center of gravity.
The stars are so tightly crammed together that astronomers had to wait for the powerful vision of NASA's Hubble Space Telescope to peer deep into the core of the "beehive" and resolve individual stars. Hubble's vision is so sharp, it can even measure the motion of many of these stars — and over a relatively short span of time.
A precise measurement of star motions in giant clusters can yield insights into how stellar groupings formed in the early universe and whether an intermediate mass black hole, one roughly 10,000 times as massive as our Sun, might be lurking among the stars.
Analyzing archived images taken over a 4-year period by Hubble's Advanced Camera for Surveys, astronomers have made the most accurate measurements yet of the motions of more than 100,000 cluster inhabitants, the largest survey to date to study the movement of stars in any cluster.
"It takes high-speed, sophisticated computer programs to measure the tiny shifts in the positions of the stars that occur in only 4 years' time," said Jay Anderson from the Space Telescope Science Institute (STScI) in Baltimore, Maryland, who conducted the study with Roeland van der Marel, also from STScI. "Ultimately, though, it is Hubble's razor-sharp vision that is the key to our ability to measure stellar motions in this cluster."
"With Hubble, you can wait 3 or 4 years and detect the motions of the stars more accurately than if you had waited 50 years on a ground-based telescope,” Anderson said.
The astronomers used the Hubble images, which were taken in 2002 and 2006, to make a movie simulation of the frenzied motion of the cluster's stars. The movie shows the stars' projected migration over the next 10,000 years.
Identified as a globular star cluster in 1867, Omega Centauri is one of roughly 150 such clusters in our Milky Way Galaxy. The behemoth stellar grouping is the biggest and brightest globular cluster in the Milky Way, and one of the few that can be seen by the unaided eye. Located in the constellation Centaurus, Omega Centauri is viewable in the southern skies.
Weighing a star using a moon
If a star has a planet, and that planet has a moon, and both of them cross in front of their star, then scientists can measure their sizes and orbits to learn about the star.
Provided by Harvard-Smithsonian Center, Cambridge
Published: October 18, 2010
How do astronomers weigh a star that's trillions of miles away and way too big to fit on a bathroom scale? In most cases, they can't, although they can get a best estimate using computer models of stellar structure.
New work by astrophysicist David Kipping says that in special cases, astronomers can weigh a star directly. If the star has a planet, and that planet has a moon, and both of them cross in front of their star, then scientists can measure their sizes and orbits to learn about the star.
"I often get asked how astronomers weigh stars," said Kipping from the Harvard-Smithsonian Center for Astrophysics in Cambridge, Massachusetts. "We've just added a new technique to our toolbox for that purpose," he said.
Astronomers have found more than 90 planets that cross in front of, or transit, their stars. By measuring the amount of starlight that's blocked, they can calculate how big the planet is relative to the star. But they can't know exactly how big the planet is unless they know the actual size of the star. Computer models give a very good estimate, but in science, real measurements are best.
Kipping realized that if a transiting planet has a moon big enough for astronomers to see — by also blocking starlight — then the planet-moon-star system could be measured in a way that lets them calculate exactly how large and massive all three bodies are.
"Basically, we measure the orbits of the planet around the star and the moon around the planet. Then through Kepler's laws of motion, it's possible to calculate the mass of the star," said Kipping.
The process isn't easy and requires several steps. By measuring how the star's light dims when planet and moon transit, astronomers learn three key numbers: 1) the orbital periods of the moon and planet; 2) the size of their orbits relative to the star; and 3) the size of planet and moon relative to the star.
Plugging those numbers into Kepler's third law yields the density of the star and planet. Because density is mass divided by volume, the relative densities and relative sizes gives the relative masses. Finally, scientists measure the star's wobble due to the planet's gravitational tug, known as the radial velocity. Combining the measured velocity with the relative masses, they can calculate the mass of the star directly.
"If there was no moon, this whole exercise would be impossible," said Kipping. "No moon means we can't work out the exact density of the planet, so the whole thing grinds to a halt."
Kipping hasn't put his method into practice yet because no star is known to have both a planet and moon that transit. However, NASA's Kepler spacecraft should discover several such systems.
"When they're found, we'll be ready to weigh them," said Kipping.
Unsteady rocking motion of Saturn's icy moon may keep its oceans liquid
At least four distinct plumes of water ice spew out from the south polar region of Saturn's moon Enceladus in this dramatically illuminated image.
Photo by NASA/JPL/Space Science Institute
Goddard Space Flight Center, Greenbelt, Maryland
October 7,2010
Saturn's icy moon Enceladus should not be one of the most promising places in our solar system to look for extraterrestrial life. Instead, it should have frozen solid billions of years ago. Located in the frigid outer solar system, it's too far from the sun to have oceans of liquid water, a necessary ingredient for known forms of life on its surface.
Some worlds, like Mars or Jupiter's moon Europa, give hints that they might harbor liquid water beneath their surfaces. Mars is about 4,200 miles (6,800 kilometers) across and Europa almost 2,000 miles (3,200 km) across. However, with a diameter only slightly more than 500 miles (800 km), Enceladus just doesn't have the bulk needed for its interior to stay warm enough to maintain liquid water underground.
With temperatures around -324 degrees Fahrenheit (-198 degrees Celsius), the surface of Enceladus is indeed frozen. However, in 2005, NASA's Cassini spacecraft discovered a giant plume of water gushing from cracks in the surface over the moon's south pole, indicating that there was a reservoir of water beneath the ice. Analysis of the plume by Cassini revealed that the water is salty, indicating the reservoir is large, perhaps even a global subsurface ocean. Scientists estimate from the Cassini data that the south polar heating is equivalent to a continuous release of about 13 billion watts of energy.
To explain this mysterious warmth, some scientists invoke radiation coupled with tidal heating. As it formed, Enceladus, like all solar system objects, incorporated matter from the cloud of gas and dust left over from our sun's formation. In the outer solar system, as Enceladus formed it grew as ice and rock coalesced. If Enceladus was able to gather greater amounts of rock, which contained radioactive elements, enough heat could have been generated by the decay of the radioactive elements in its interior to melt the body.
However, in smaller moons like Enceladus, the cache of radioactive elements usually is not massive enough to produce significant heat for long, and the moon should have soon cooled and solidified. So, unless another process within Enceladus somehow generated heat, any liquid formed by the melting of its interior would have frozen long ago.
This led scientists to consider the role of tidal heating as a way to keep Enceladus warm enough for liquid water to remain under its surface. Enceladus' orbit around Saturn is slightly oval-shaped. As it travels around Saturn, Enceladus moves closer in and then farther away. When Enceladus is closer to Saturn, it feels a stronger gravitational pull from the planet than when it is farther away. Like gently squeezing a rubber ball slightly deforms its shape, the fluctuating gravitational tug on Enceladus causes it to flex slightly. The flexing, called gravitational tidal forcing, generates heat from friction deep within Enceladus.
The gravitational tides also produce stress that cracks the surface ice in certain regions, like the south pole, and may be reworking those cracks daily. Tidal stress can pull these cracks open and closed while also shearing them back and forth. As they open and close, the sides of the south polar cracks move as much as a few feet, and they slide against each other by up to a few feet as well. This movement generates friction, which releases extra heat at the surface at locations that should be predictable with our understanding of tidal stress.
To test the tidal heating theory, scientists with the Cassini team created a map of the gravitational tidal stress on the moon's icy crust and compared it to a map of the warm zones created using Cassini's composite infrared spectrometer instrument (CIRS). Assuming the greatest stress is where the most friction occurs, and therefore where the most heat is released, areas with the most stress should overlap the warmest zones on the CIRS map.
"However, they don't exactly match," said Terry Hurford of NASA's Goddard Space Flight Center in Greenbelt, Maryland. "For example, in the fissure called the Damascus Sulcus, the area experiencing the greatest amount of shearing is about 31 miles (50 kilometers) from the zone of greatest heat."
Hurford and his team believe the discrepancy can be resolved if Enceladus' rotation rate is not uniform — if it wobbles slightly as it rotates. Enceladus' wobble, technically called "libration," is barely noticeable. "Cassini observations have ruled out a wobble greater than about 2 degrees with respect to Enceladus' uniform rotation rate," said Hurford.
The team created a computer simulation that made maps of the surface stress on Enceladus for various wobbles, and found a range where the areas of greatest stress line up better with the observed warmest zones.
"Depending on whether the wobble moves with or against the movement of Saturn in Enceladus' sky, a wobble ranging from 2 degrees down to 0.75 degree produces the best fit to the observed warmest zones," said Hurford.
The wobble also helps with the heating conundrum by generating about five times more heat in Enceladus' interior than tidal stress alone, and the extra heat makes it likely that Enceladus' ocean could be long-lived, according to Hurford. This is significant in the search for life, because life requires a stable environment to develop.
The wobble is probably caused by Enceladus' uneven shape. "Enceladus is not completely spherical, so as it moves in its orbit, the pull of Saturn's gravity generates a net torque that forces the moon to wobble," said Hurford. Also, Enceladus' orbit is kept oval-shaped, maintaining the tidal stress, because of the gravitational tug from Dione, a neighboring larger moon. Dione is farther away from Saturn than Enceladus, so it takes longer to complete its orbit. For every orbit Dione completes, Enceladus finishes two, producing a regular alignment that pulls Enceladus' orbit into an oval shape.
What is a Fuzzball?
Credit: ESA (European Space Agency)
Cygnus X-1, an 8.7‑solar-mass black hole only 6,000 light years away in our own Milky Way galaxy, belongs to a binary system along with a blue supergiant variable star. If Cygnus X-1 is actually a fuzzball, its surface has a diameter of 51 kilometers.
Fuzzballs are theorized by some superstring theory scientists to be the true quantum description of black holes. The theory resolves two intractable problems that classic black holes pose for modern physics:
1. The information paradox wherein the quantum information bound in in‑falling matter and energy entirely disappears into a singularity; that is, the black hole would undergo zero physical change in its composition regardless of the nature of what fell into it.
2. The singularity at the heart of the black hole, where conventional black hole theory says there is infinite spacetime curvature due to an infinitely intense gravitational field from a region of zero volume. Modern physics breaks down when such parameters are infinite and zero.
Fuzzball theory replaces the singularity at the heart of a black hole by positing that the entire region within the black hole’s event horizon is actually a ball of strings, which are advanced as the ultimate building blocks of matter and energy. Strings are thought to be bundles of energy vibrating in complex ways in both the three physical dimensions of space as well as in compact directions—extra dimensions interwoven in the quantum foam (also known as spacetime foam).
Samir Mathur of Ohio State University, with postdoctoral researcher Oleg Lunin, proposed via two papers in 2002 that black holes are actually spheres of strings with a definite volume; they are not a singularity, which the classic view holds to be a zero-dimensional, zero-volume point into which a black hole’s entire mass is concentrated.
String theory holds that the fundamental constituents of subatomic particles, including the force carriers (e.g., quarks, leptons, photons, and gluons), all comprise a one-dimensional string of energy that takes on its identity by vibrating in different modes and/or frequencies. Quite unlike the view of a black hole as a singularity, a small fuzzball can be thought of as an extra-dense neutron star where its neutrons have decomposed, or “melted,” liberating the quarks (strings in string theory) comprising them. Accordingly, fuzzballs can be regarded as the most extreme form of degenerate matter.
Whereas the event horizon of a classic black hole is thought to be very well defined and distinct, Mathur and Lunin further calculated that the event horizon of a fuzzball would, at an extremely small scale (likely on the order of a few Planck lengths),be very much like a mist: fuzzy, hence the name “fuzzball.” They also found that the physical surface of the fuzzball would have a radius equal to that of the event horizon of a classic black hole; for both, the Schwarzschild radius for a median-size stellar-mass black hole of 6.8 solar masses is 20 kilometers—roughly the size of the island of Kauai in Hawaii.
With classical black holes, objects passing through the event horizon on their way to the singularity are thought to enter a realm of curved spacetime where the escape velocity exceeds the speed of light. It is a realm that is devoid of all structure. Further, at the singularity—the heart of a classic black hole—spacetime is thought to have infinite curvature (that is, gravity is thought to have infinite intensity) since its mass is believed to have collapsed to zero (infinitely small) volume where it has infinite density. Such infinite conditions are problematic with known physics because key calculations utterly collapse. With a fuzzball however, the strings comprising an object are believed to simply fall onto and absorb into the surface of the fuzzball, which corresponds to the event horizon—the threshold at which the escape velocity equals the speed of light.
A fuzzball is a black hole; spacetime, photons, and all else that is not exquisitely close to the surface of a fuzzball are thought to be affected in precisely the same fashion as with a classic black hole featuring a singularity at its center. Classic black holes and fuzzballs differ only at the quantum level; that is, they differ only in their internal composition as well as how they affect virtual particles that form close to their event horizons (see Information paradox, below). Fuzzball theory is thought by its proponents to be the true quantum description of black holes.
Since the volume of fuzzballs is a function of the Schwarzschild radius (2,954 meters per solar mass), fuzzballs have a variable density that decreases as the inverse square of their mass (twice the mass is twice the diameter, which is eight times the volume, resulting in one‑quarter the density). A typical 6.8‑solar-mass fuzzball would have a mean density of 4.0×10^17 kg/m3. A bit of such a fuzzball the size of a drop of water would have a mass of twenty million metric tons, which is the mass of a granite ball 240 meters in diameter is tall). Though such densities are almost unimaginably extreme, they are, mathematically speaking, infinitely far from infinite density. Although the densities of typical stellar-mass fuzzballs are quite great—about the same as neutron stars—their densities are many orders of magnitude less than the Planck density (5.155×10^96 kg/m3), which is equivalent to the mass of the universe packed into the volume of a single atomic nucleus.
Fuzzballs become less dense as their mass increases due to fractional tension. When matter or energy (strings) fall onto a fuzzball, more strings aren’t simply added to the fuzzball; strings fuse together, and in doing so, all the quantum information of the in‑falling strings becomes part of larger, more complex strings. Due to fractional tension, string tension exponentially decreases as they become more complex with more modes of vibration, relaxing to considerable lengths. The “mathematical beauty” of the string theory formulas Mathur and Lunin employed lies in how the fractional tension values produce fuzzball radii that precisely equal Schwarzschild radii, which Karl Schwarzschild calculated using an entirely different mathematical technique 87 years earlier.
Due to the mass-density inverse-square rule, all fuzzballs need not have unimaginable densities. There are also supermassive black holes, which are found at the center of virtually all galaxies. Sagittarius A*, the black hole at the center of our Milky Way galaxy, is 4.3 million solar masses. If it is actually a fuzzball, it has a mean density that is “only” 51 times that of gold. At 3.9 billion solar masses, near the upper bounds for supermassive black holes, a fuzzball would have a radius of 77 astronomical units—about the same size as the termination shock of our solar system’s heliosphere—and a mean density equal to that of the Earth's atmosphere at sea level (1.2 kg/m3).
Irrespective of a fuzzball’s mass and resultant density, the determining factor establishing where its surface lies is the threshold at which the fuzzball’s escape velocity precisely equals the speed of light.Escape velocity, as its name suggests, is the velocity a body must achieve to escape from a massive object. For earth, this is 11.2 km/s. In the other direction, a massive object’s escape velocity is equal to the impact velocity achieved by a falling body that has fallen from the edge of a massive object’s sphere of gravitational influence. Thus, event horizons—for both classic black holes and fuzzballs—lie precisely at the point where spacetime has warped to such an extent that falling bodies just achieve the speed of light. According to Albert Einstein, via his special theory of relativity, the speed of light is the maximum permissible velocity in spacetime. At this velocity, infalling matter and energy impacts the surface of the fuzzball and its now-liberated, individual strings contribute to the fuzzball’s makeup.
Sunday, August 15, 2010
Star heavier than 250 solar systems!!!!!!!
Fig: The Young Cluster R136a and Star R136a1
July 21, 2010
Using a combination of instruments on the European Southern Observatory's (ESO) Very Large Telescope (VLT), a team of astronomers has discovered the most massive stars to date. One star at birth had more than 300 times the mass of the Sun, twice as much as the currently accepted limit. The existence of these monsters — millions of times more luminous than the Sun, losing mass through very powerful winds — may provide an answer to the question, "How massive can stars be?"
A team of astronomers led by Paul Crowther from University of Sheffield, United Kingdom, used ESO's VLT, as well as archival data from the NASA/European Space Agency's (ESA) Hubble Space Telescope, to study two young clusters of stars, NGC 3603 and RMC 136a. NGC 3603 is a cosmic factory where stars form frantically from the nebula's extended clouds of gas and dust, located 22,000 light-years from the Sun. RMC 136a (nicknamed R136) is another cluster of young, massive, and hot stars, located inside the Tarantula Nebula, in one of our neighboring galaxies, the Large Magellanic Cloud, 165,000 light-years away.
The team found several stars with surface temperatures more than 7 times hotter than our Sun, tens of times larger, and several million times brighter. Comparisons with models imply that several of these stars were born with masses in excess of 150 solar masses. The star R136a1, found in the R136 cluster, is the most massive star ever found with a current mass of about 265 solar masses and a birth mass of as much as 320 times that of the Sun.
In NGC 3603, the astronomers could also directly measure the masses of two stars that belong to a double star system. The stars A1, B, and C in this cluster have estimated masses at birth above or close to 150 solar masses. The star A1 is a double star with an orbital period of 3.77 days. The two stars in the system have, respectively, 120 and 92 times the mass of the Sun, which means that they formed as stars of 148 and 106 solar masses, respectively.
Massive stars have such high luminosities with respect to their mass that they produce powerful outflows. "Unlike humans, these stars are born heavy and lose weight as they age," said Crowther. "Being a little over a million years old, the most extreme star, R136a1, is already 'middle-aged' and has undergone an intense weight-loss program, shedding a fifth of its initial mass over that time, or more than 50 solar masses."
If R136a1 replaced the Sun in our solar system, it would outshine the Sun by as much as the Sun currently outshines the Full Moon. "Its high mass would reduce the length of Earth's year to 3 weeks, and it would bathe the Earth in incredibly intense ultraviolet radiation, rendering life on our planet impossible," said Raphael Hirschi from Keele University, Staffordshire, United Kingdom.
These heavyweight stars are extremely rare, forming solely within the densest star clusters. To distinguish the individual stars for the first time required the exquisite resolving power of the VLT.
The team also estimated the maximum possible mass for the stars within these clusters and the relative number of the most massive ones. "The smallest stars are limited to more than about 80 times more than Jupiter, below which they are 'failed stars' or brown dwarfs," said team member Olivier Schnurr from the Astrophysikalisches Institut Potsdam, Germany. "Our new finding supports the previous view that there is also an upper limit to how big stars can get, but it raises the limit by a factor of two to about 300 solar masses."
Within R136, only four stars weighed more than 150 solar masses at birth, yet they account for nearly half of the wind and radiation power of the entire cluster, comprising approximately 100,000 stars in total. R136a1 alone energizes its surroundings by more than a factor of 50 compared to the Orion Nebula cluster.
An observer on a (hypothetical) planet in the R136 cluster would have a dramatic view. The density of stars in the cluster is about 100,000 times higher than around our Sun. Many of these stars are incredibly bright, so the planet's sky would never get dark.
Understanding how high-mass stars form is puzzling enough due to their short lives and powerful winds, so the identification of such extreme cases as R136a1 raises the challenge to theorists still further. "Either they were born so big or smaller stars merged together to produce them," said Crowther.
Stars between about 8 and 150 solar masses explode at the end of their short lives as supernovae, leaving behind exotic remnants of either a neutron star or a black hole. Having established the existence of stars between 150 and 300 solar masses, the astronomers' findings raise the prospect of the existence of exceptionally bright, "pair instability supernovae" that completely blow themselves apart, failing to leave behind any remnant and dispersing up to 10 solar masses of iron into their surroundings. A few candidates for such explosions have already been proposed in recent years.
Not only is R136a1 the most massive star ever found, but also it has the highest luminosity too, close to 10 million times greater than the Sun. "Owing to the rarity of these monsters, I think it is unlikely that this new record will be broken any time soon," said Crowther.
Thursday, February 11, 2010
Giant Intergalactic Gas Stream Longer than Thought
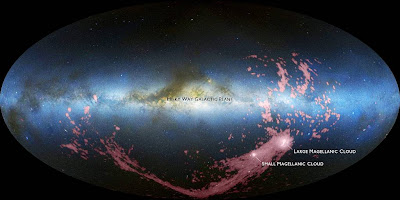
Combined radio/optical image shows Milky Way, Magellanic Clouds, and the new radio image of the Magellanic Stream. Blue and white are the Milky Way and Magellanic Clouds. Red is the hydrogen gas in the Magellanic Stream, in the disks of the Magellanic Clouds, and in the stream's Leading Arm. The Milky Way is horizontal in the middle of the image; the Magellanic Clouds are the light spots at the center-right portion of the image, from which the gas stream originates. Brown is dust clouds in the Milky Way. CREDIT: Nidever, et al., NRAO/AUI/NSF and Meilinger, Leiden-Argentine-Bonn Survey, Parkes Observatory, Westerbork Observatory, Arecibo Observatory.
Monday, January 04, 2010
The astronomers used the National Science Foundation's Robert C. Byrd Green Bank Telescope (GBT) to fill important gaps in the picture of gas streaming outward from the Magellanic Clouds. The first evidence of such a flow, named the Magellanic Stream, was discovered more than 30 years ago, and subsequent observations added tantalizing suggestions that there was more. However, the earlier picture showed gaps that left unanswered whether this other gas was part of the same system.
"We now have answered that question. The stream is continuous," said David Nidever, of the University of Virginia. "We now have a much more complete map of the Magellanic Stream," he added. The astronomers presented their findings to the American Astronomical Society's meeting in Washington, DC.
The Magellanic Clouds are the Milky Way's two nearest neighbor galaxies, about 150,000 to 200,000 light-years distant from the Milky Way. Visible in the Southern Hemisphere, they are much smaller than our Galaxy and may have been distorted by its gravity.
Nidever and his colleagues observed the Magellanic Stream for more than 100 hours with the GBT. They then combined their GBT data with that from earlier studies with other radio telescopes, including the Arecibo telescope in Puerto Rico, the Parkes telescope in Australia, and the Westerbork telescope in the Netherlands. The result shows that the stream is more than 40 percent longer than previously known with certainty.
One consequence of the added length of the gas stream is that it must be older, the astronomers say. They now estimate the age of the stream at 2.5 billion years.
The revised size and age of the Magellanic Stream also provides a new potential explanation for how the flow got started.
"The new age of the stream puts its beginning at about the time when the two Magellanic Clouds may have passed close to each other, triggering massive bursts of star formation," Nidever explained. "The strong stellar winds and supernova explosions from that burst of star formation could have blown out the gas and started it flowing toward the Milky Way," he said.
"This fits nicely with some of our earlier work that showed evidence for just such blowouts in the Magellanic Clouds," said Steven Majewski, of the University of Virginia.
Earlier explanations for the stream's cause required the Magellanic Clouds to pass much closer to the Milky Way, but recent orbital simulations have cast doubt on such mechanisms.
Nidever and Majewski worked with Butler Burton of the Leiden Observatory and the National Radio Astronomy Observatory, and Lou Nigra of the University of Wisconsin. In addition to presenting the results to the American Astronomical Society, the scientists have submitted a paper to the Astrophysical Journal.
Centuries-Old Star Mystery Coming to a Close
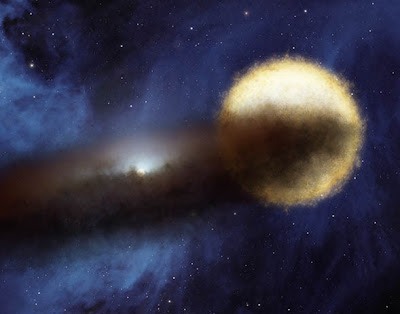
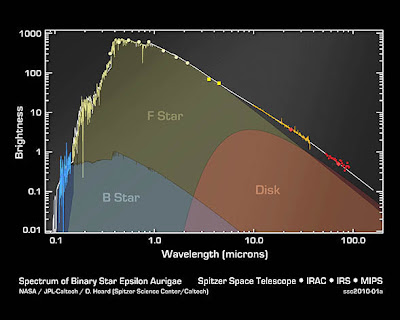
This graph of data from multiple telescopes shows the distribution of light from a pair of stars known as Epsilon Aurigae. For centuries, astronomers had not been able to figure out the nature of this "eclipsing binary system," in which a bright naked-eye star is eclipsed by a companion object every 27 years.Data from NASA's Spitzer Space Telescope are pointing to a solution to this age-old riddle. The Spitzer data, shown in bright yellow and orange, provide the missing puzzle pieces need to fit all the data on the star together into a neat model. The blue data show ultraviolet observations, and the light yellow/green data are from visible-light telescopes. The blue data show light from the companion object, a so-called B star, while the light yellow data show light from the main bright star, called an F star. The orange and bright yellow data from Spitzer show light from the F star and a dusty disk that is surrounding the B-star.The new model indicates that the F star is not a supergiant as a favored theory had proposed but a dying star with a lot less mass.
January,2010
For almost two centuries, humans have looked up at a bright star called Epsilon Aurigae and watched with their own eyes as it seemed to disappear into the night sky, slowly fading before coming back to life again. Today, as another dimming of the system is underway, mysteries about the star persist. Though astronomers know that Epsilon Aurigae is eclipsed by a dark companion object every 27 years, the nature of both the star and object has remained unclear.
Now, new observations from NASA's Spitzer Space Telescope -- in combination with archived ultraviolet, visible and other infrared data -- point to one of two competing theories, and a likely solution to this age-old puzzle. One theory holds that the bright star is a massive supergiant, periodically eclipsed by two tight-knit stars inside a swirling, dusty disk. The second theory holds that the bright star is in fact a dying star with a lot less mass, periodically eclipsed by just a single star inside a disk. The Spitzer data strongly support the latter scenario.
"We've really shifted the balance of the two competing theories," said Donald Hoard of NASA's Spitzer Science Center at the California Institute of Technology in Pasadena. "Now we can get busy working out all the details." Hoard presented the results today at the 215th meeting of the American Astronomical Meeting in Washington.
Epsilon Aurigae can be seen at night from the northern hemisphere with the naked eye, even in some urban areas. Last August, it began its roughly two-year dimming, an event that happens like clockwork every 27.1 years and results in the star fading in brightness by one-half. Professional and amateur astronomers around the globe are watching, and the International Year of Astronomy 2009 marked the eclipse as a flagship "citizen science" event. More information is at http://www.citizensky.org .
Astronomers study these eclipsing binary events to learn more about the evolution of stars. Because one star passes in front of another, additional information can be gleaned about the nature of the stars. In the case of Epsilon Aurigae, what could have been a simple calculation has instead left astronomers endlessly scratching their heads. Certain aspects of the event, for example the duration of the eclipse, and the presence of "wiggles" in the brightness of the system during the eclipse, have not fit nicely into models. Theories have been put forth to explain what's going on, some quite elaborate, but none with a perfect fit.
The main stumper is the nature of the naked-eye star -- the one that dims and brightens. Its spectral features indicate that it's a monstrous star, called an F supergiant, with 20 times the mass, and up to 300 times the diameter, of our sun. But, in order for this theory to be true, astronomers had to come up with elaborate scenarios to make sense of the eclipse observations. They said that the eclipsing, companion star must actually be two so-called B stars surrounded by an orbiting disk of dusty debris. And some scenarios were even more exotic, calling for black holes and massive planets.
A competing theory proposed that the bright star was actually a less massive, dying star. But this model had holes too. There was no simple solution.
Hoard became interested in the problem from a technological standpoint. He wanted to see if Spitzer, whose delicate infrared arrays are too sensitive to observe the bright star directly, could be coaxed to observe it using a clever trick. "We pointed the star at the corner of four of Spitzer's pixels, instead of directly at one, to effectively reduce its sensitivity." What's more, the observation used exposures lasting only one-hundredth of a second -- the fastest that images can be obtained by Spitzer.
The resulting information, in combination with past Spitzer observations, represents the most complete infrared data set for the star to date. They confirm the presence of the companion star's disk, without a doubt, and establish the particle sizes as being relatively large like gravel rather than like fine dust.
But Hoard and his colleagues were most excited about nailing down the radius of the disk to approximately four times the distance between Earth and the sun. This enabled the team to create a multi-wavelength model that explained all the features of the system. If they assumed the F star was actually a much less massive, dying star, and they also assumed that the eclipsing object was a single B star embedded in the dusty disk, everything snapped together.
"It was amazing how everything fell into place so neatly," said Steve Howell of the National Optical Astronomy Observatory in Tucson, Ariz. "All the features of this system are interlinked, so if you tinker with one, you have to change another. It's been hard to get everything to fall together perfectly until now."
According to the astronomers, there are still many more details to figure out. The ongoing observations of the current eclipse should provide the final clues needed to put this mystery of the night sky to rest.
Forming the present-day spiral galaxies
Image credit: NASA, ESA, Sloan Digital Sky Survey,
R. Delgado-Serrano and F. Hammer (Observatoire de Paris)
Using data from the NASA/ESA Hubble Space Telescope, astronomers have, for the first time, created a demographic census of galaxy types and shapes from a time before the Earth and the Sun existed, to the present day. The results show that, contrary to contemporary thought, more than half of the present-day spiral galaxies had so-called peculiar shapes only 6 billion years ago, which, if confirmed, highlights the importance of collisions and mergers in the recent past of many galaxies. It also provides clues for the unique status of our own galaxy, the Milky Way.
Thursday, February 04, 2010
Galaxy morphology, or the study of the shapes and formation of galaxies, is a critical and much-debated topic in astronomy. An important tool for this is the Hubble sequence or Hubble tuning-fork diagram [1], a classification scheme invented in 1926 by the same Edwin Hubble in whose honour the space telescope is named.
A team of European astronomers led by François Hammer of the Observatoire de Paris has, for the first time, completed a demographic census of galaxy types at two different points in the Universe's history — in effect, creating two Hubble sequences — that help explain how galaxies form [2]. In this survey, researchers sampled 116 local galaxies and 148 distant galaxies.
Contrary to previous thought, the astronomers showed that the Hubble sequence six billion years ago was very different from the one that astronomers see today.
"Six billion years ago, there were many more peculiar galaxies than now — a very surprising result," says Rodney Delgado-Serrano, lead author of the related paper recently published in and highlighted on the cover of Astronomy & Astrophysics. "This means that in the last six billion years, these peculiar galaxies must have become normal spirals, giving us a more dramatic picture of the recent Universe than we had before."
The astronomers think that these peculiar galaxies did indeed become spirals through collisions and merging. Tracing the history of galaxy formation leads us to the way our Universe presently looks. Like any review of a life, there are chaotic, tumultuous times and more dormant periods and, like many teenagers, developing galaxies often collide with those in their way. Crashes between galaxies give rise to enormous new galaxies and, although it was commonly believed that galaxy mergers decreased significantly eight billion years ago, the new result implies that mergers were still occurring frequently after that time — up to as recently as four billion years ago.
"Our aim was to find a scenario that would connect the current picture of the Universe with the morphologies of distant, older galaxies — to find the right fit for this puzzling view of galaxy evolution", says Hammer.
Also contrary to the widely held opinion that galaxy mergers result in the formation of elliptical galaxies, Hammer and his team support a scenario in which these cosmic clashes result in spiral galaxies. In a parallel paper published in Astronomy & Astrophysics [3], Hammer and his team delve further into their "spiral rebuilding" hypothesis, which proposes that peculiar galaxies affected by gas-rich mergers are slowly reborn as giant spirals with discs and central bulges.
Although our own Milky Way galaxy is a spiral galaxy, it seems to have been spared much of the teenage drama; its formation history has been rather quiet and it has avoided violent collisions in astronomically recent times. However, the large Andromeda galaxy from our neighbourhood has not been so lucky and fits well into the "spiral rebuilding" scenario. Researchers continue to seek out explanations for this.
Hammer and his team used data from the Sloan Digital Sky Survey [4] undertaken by Apache Point Observatory, New Mexico, USA and from the GOODS field and Hubble Ultra Deep Field taken by the Advanced Camera for Surveys (ACS) aboard Hubble.
Notes for editors:
[1] Hubble's scheme divides regular galaxies into three broad classes — ellipticals, lenticulars and spirals — based on their visual appearance (originally on photographic plates). A fourth class contains galaxies with an irregular appearance.
[2] R. Delgado-Serrano, et al, 2010, How was the Hubble Sequence, 6 Giga-years ago?, Astronomy & Astrophysics, 509, A78
[3] F. Hammer et al., 2009, The Hubble Sequence: just a vestige of merger events?, Astronomy & Astrophysics, 507, 1313
[4] Over eight years of operations, the Sloan Digital Sky Survey (SDSS) obtained deep, multicolour images covering more than a quarter of the sky and created three-dimensional maps containing more than 930 000 galaxies and more than 120 000 quasars. The SDSS used a dedicated 2.5-metre telescope at Apache Point Observatory, New Mexico, equipped with two powerful special purpose instruments. The 120-megapixel camera imaged 1.5 square degrees of sky at a time, about eight times the area of the full Moon. A pair of spectrographs fed by optical fibres measured spectra of (and hence distances to) more than 600 galaxies and quasars in a single observation.
Subscribe to:
Posts (Atom)